Single-Group SILAC-based Quantitative Proteome Analysis
A published dataset [1] was used as an example to demonstrate the capability of single-group SILAC-based data analysis in PEAKS Studio.
Study Aims & Background
Angiotensin II (AngII) is a major effector of the renin-angiotensin system and mediates kidney disease progression. However there are no specific measures of renal AngII activity. This study aimed to define AngII-regulated proteomes thus to identify potential AngII activity markers in the kidney.

Experimental Design
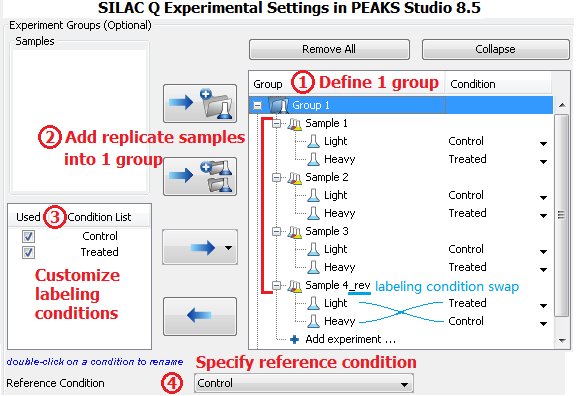
Primary human renal cells were either cultured in regular medium or in 13C6-arginine (R6) and 13C615N2-lysine (K8) medium. After 6 passages, AngII was added to SILAC-labeled cells and proteins of the treated and control cells were extracted and mixed at 1:1 protein ratio. In total, four replicates were performed, in one of which cells grown in regular medium were treated with AngII (labeling condition swapped). In the experimental settings in PEAKS Studio 8.5, control condition was specified as the reference condition so that ratios of the treated relative to control are calculated.
MS data was analyzed in PEAKS Studio 8.5 using a customized SILAC-2plex (R6, K8) method in PEAKS Q for quantification.
Result
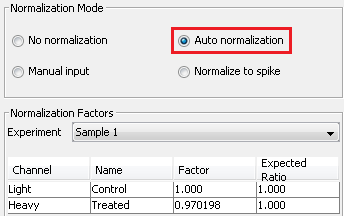
- Normalization of SILAC ratios in each sample
Auto normalization was first performed in PEAKS Q so that the total light and heavy intensities in each sample were equivalent since the same amount of light and heavy proteins were mixed. The adjusted normalization factor is displayed for each sample in the normalization setting window.
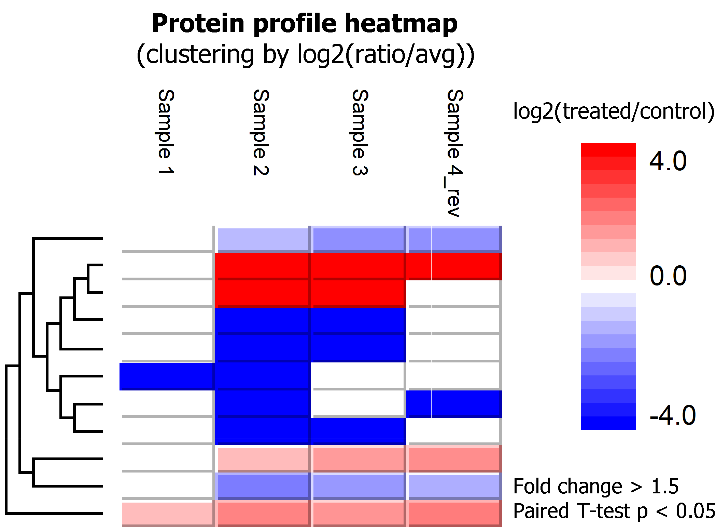
- Identification of differentially expressed proteins between groups
SILAC ratios of proteins were calculated using the median of peptide ratios (MS1 peak area in the labeling channel relative to the reference channel). Proteins that had significantly differential expressions between treated and control conditions across four replicates could be identified by applying a fold change filter of, e.g. at least 1.5, and a paired T-test p value smaller than 5%. Paired T-test is the statistical tool integrated in PEAKS Q for single-group SILAC data analysis.
Conclusions
PEAKS Studio supports complex SILAC data analysis and offers built-in statistical tools to identify proteins with significant changes of expression levels.
References
- Konvalinka, A., Zhou, J., Dimitromanolakis, A., Drabovich, A. P., et al., Determination of an angiotensin II-regulated proteome in primary human kidney cells by stable isotope labeling of amino acids in cell culture (SILAC). The Journal of biological chemistry 2013, 288, 24834-24847.