
False Discovery Rate
PEAKS FDR Estimation
Overview
Software has been routinely used to identify peptides from mass spectrometry data. Just like that scientific experiments need to be conducted with controls, software’s peptide identification results also need to be statistically validated to avoid false positives. For today’s peptide identification, the most accepted result validation method is through false discovery rate (FDR). This article explains what FDR is; how it is practically calculated; and a few common mistakes in the use of FDR controls.
The core of each peptide identification software is a scoring function that evaluates the matching quality between a peptide and an MS/MS spectrum. For every MS/MS spectrum in the data, the software searches the protein database to find a peptide that maximises the peptide-spectrum matching score. The match between the spectrum and the highest-scoring peptide is usually referred to as a peptide-spectrum match (PSM).
A number of reasons can cause a PSM to be false, these include:
- Low quality spectrum;
- Peptides not in the database; and
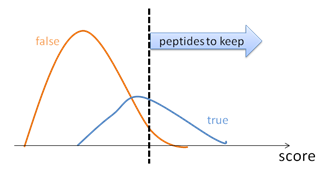
- Imperfect scoring function. To control the result quality, the PSMs are sorted by their scores. By choosing a proper score threshold, the quality of the PSMs above the threshold can be satisfied (Figure 1). False discovery rate, or FDR, is defined to be the ratio between the false PSMs and the total number of PSMs above the score threshold.
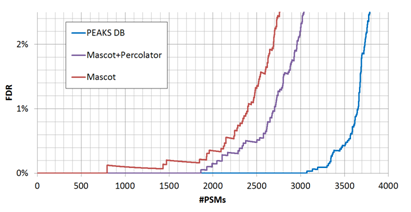
By adjusting the score thresholds, the result accuracy (FDR) can be traded with the sensitivity (number of reported identifications). Different software equipped with different scoring functions may have significant different trade-off efficiencies, as indicated by the FDR curves in Figure 2.
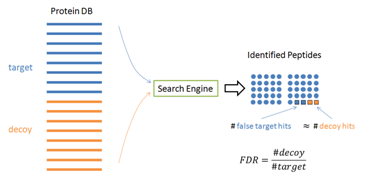
In practice, it is hard to tell which PSM is false – otherwise those false PSMs can be removed by the algorithm to achieve zero false discoveries. Therefore, the target-decoy method [1] has been widely used in practice to estimate the FDR. In this method, the software is used to search the concatenation of a target database and a decoy database with the same size. If the decoy is constructed properly, the software’s false identifications will be evenly distributed in the target and decoy databases. Since all the decoy identifications are false, FDR can be estimated by FDR = (# Decoy Hits) / (# target hits).
Common Misuses of the Target-Decoy Method
If used properly, the target-decoy method is a statistically sound method to estimate FDR. However, the misuse of this method is common, which usually leads to over-confidence about the result quality. Here we briefly summarise some common mistakes. It is important to repeat that the “same size” and “even distribution” in last section are prerequisites for the proper use of target-decoy method. As we will see, most misuses of target-decoy method are due to the violation of these prerequisites.
Mistake 1
Use target-decoy to validate a search software that uses a multi-round search approach.
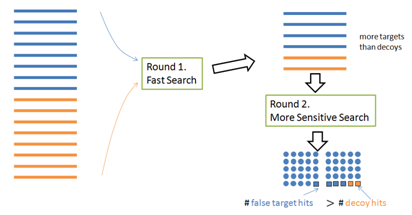
To speed up the search, a multi-round search algorithm often selects a short list of proteins from a large database in the first round, and then identifies more PSMs using the protein shortlist (instead of the whole database) in the second round. However, this approach invalidates the target-decoy method: More target proteins than decoy proteins are selected in the first round; therefore the target and decoy are not of the same size in the second round (Figure 4).
Mistake 2
Use target-decoy to validate a search software that uses the protein information in the peptide-spectrum matching score.
A PSM is more likely to be correct if its protein is of high confidence. Therefore, many software tools add a bonus to a peptide’s score if it is from a highly confident protein. While this may increase the search sensitivity, it invalidates the target-decoy method: There are more target proteins with high scores; therefore more bonuses are added to the false target hits than the false decoy hits. The false hits are not evenly distributed anymore.
Mistake 3
Re-rank the results by retraining the score function with the target and decoy hits.
This re-ranking strategy is getting popular recently because it can greatly increase the search sensitivity. However, it also invalidates the target-decoy method: A careless retraining algorithm may use too many parameters to over-fit the data and eliminate the decoy hits (but not the false target hits) completely. So this is only suggested if the retraining algorithm is designed with the over-fitting problem in mind, and the data set is very large. More explanations to these common mistakes can be found in A Practical Guide to Significantly Improving Peptide Identification Sensitivity and Accuracy.
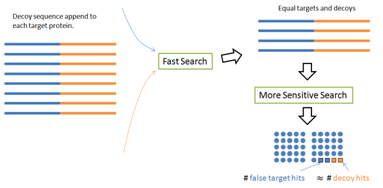
The Decoy Fusion Method
There is a simple fix to avoid the first two common mistakes — The PEAKS DB paper [1] proposed a decoy fusion method. Instead of concatenating the target and decoy databases together, the decoy fusion method concatenate the decoy and target sequences of the same protein together as a “fused” sequence (Figure 5). This simple change makes some meaningful differences. For the two round search problem, the target and decoy lengths are still the same in the second round. For the protein score problem, the same amount of bonus will be equally applied to the target and decoy parts of the same fused sequence. Thus, the “same size” and “even distribution” prerequisites are recreated; and the FDR is again estimated accurately. The built-in result validation of the PEAKS software uses this decoy fusion method.
References
- Zhang J, Xin L, Shan B, Chen W, Xie M, Yuen D, Zhang W, Zhang Z, Lajoie G.A., Ma B, PEAKS DB: De Novo Sequencing Assisted Database Search for Sensitive and Accurate Peptide Identification. Mol. Cell. Proteomics. 11, M111.010587 (2012). https://doi.org/10.1074/mcp.M111.010587