 uantification Algorithms
SILAC Pair Feature Detection & Quality Score
PEAKS Q detects and associates 2 or 3-plex SILAC feature pairs that have the same charge, similar MS1 peak intensity correlation over retention time, expected mass shifts caused by labelling and fall within certain mass errors. Each SILAC feature pair is assigned a quality score considering a series of factors such as the feature intensities, shape similarities of the extracted ion chromatograms, and mass errors. A higher quality score indicates higher confidence for quantifying the SILAC pair.
SILAC Alignment & ID Transfer
The ideal case for SILAC quantification is that there is enough information to retrieve the peptide sequence from MS/MS spectra. However, sometimes the MS/MS information is either insufficient to identify the peptide sequence or not even obtained. In order to still identify such features, MS/MS and ID can be matched from another run by aligning features within tight mass ranges and retention times. Therefore, retention times of different LC-MS runs are first aligned, and then the IDs are transferred from the run that contains enough information to the one with insufficient information.
Paired T-Test for Single Group Analysis
Paired t-test is the statistical tool integrated in PEAKS for single-group SILAC data analysis. Single-group SILAC experimental setting can be used when users try to assess whether protein expression levels change between different labelling states consistently across replicates. For example, drug treated cells are grown in SILAC heavy media (condition 1) whereas control cells in normal media (condition 2). Heavy proteins from condition 1 and light proteins from condition 2 are combined and analysed by LC-MS/MS. Paired t-test can be used to analyse whether there is a significant difference in protein levels between condition 1 and 2. Heavy and light features from one sample is considered as a pair in the paired t-test.
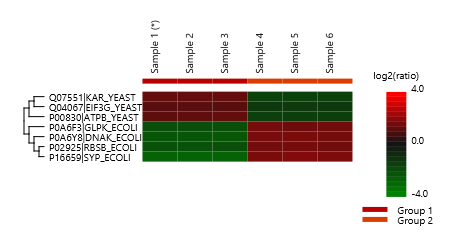
Welch’s ANOVA for Multiple Group Comparison
Welch’s ANOVA is the statistical tool integrated in PEAKS for multi-group SILAC data analysis. Multi-group SILAC experimental setting can be used when users try to assess whether protein expression ratios between different labelling states change across multiple groups. For example, drug treated cells are grown in SILAC heavy media (condition 1) whereas control cells in normal media (condition 2). At different time points, e.g. 10, 15, 20 days, heavy proteins from condition 1 and light proteins from condition 2 are combined and analysed by LC-MS/MS. ANOVA can be used to assess whether there is a significant difference in protein ratios at one time point vs other time point(s). Different times are considered as groups and each group should include at least two replicates.
The classical ANOVA is very unstable if the experimental data has unequal variances. Welch’s ANOVA is an alternative to the Classic ANOVA for such cases. For normal, different-variance, and balanced data (i.e. each group has the same number of samples), Welch’s ANOVA has the most power and the lowest type I error rate. Therefore, PEAKS SILAC Q adopts Welch’s ANOVA for multiple group comparisons.
Read our application note for multi-group SILAC-based quantitative proteome analysis with PEAKS.
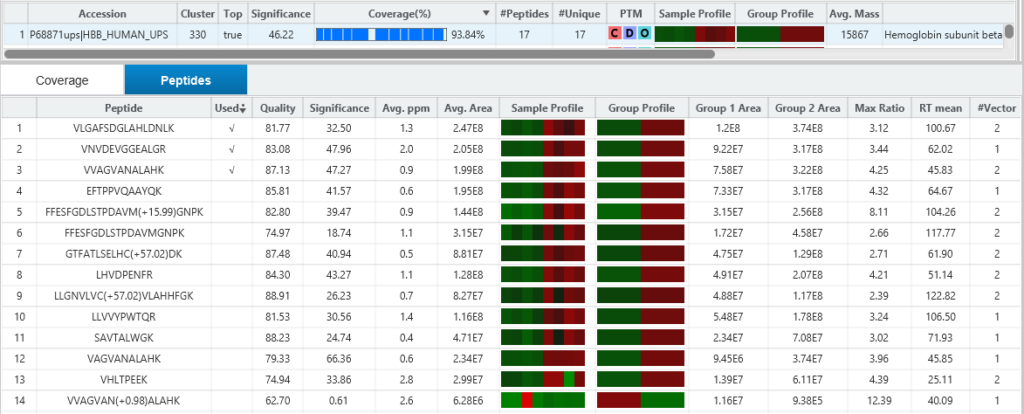
Top Three Peptide Selection for Label-Free Quantification
Select the three most abundant unique peptides for protein ratio estimation by excluding 1) peptides with both modified and unmodified forms, and 2) redundant peptides.