Peptide Feature Area
Overview
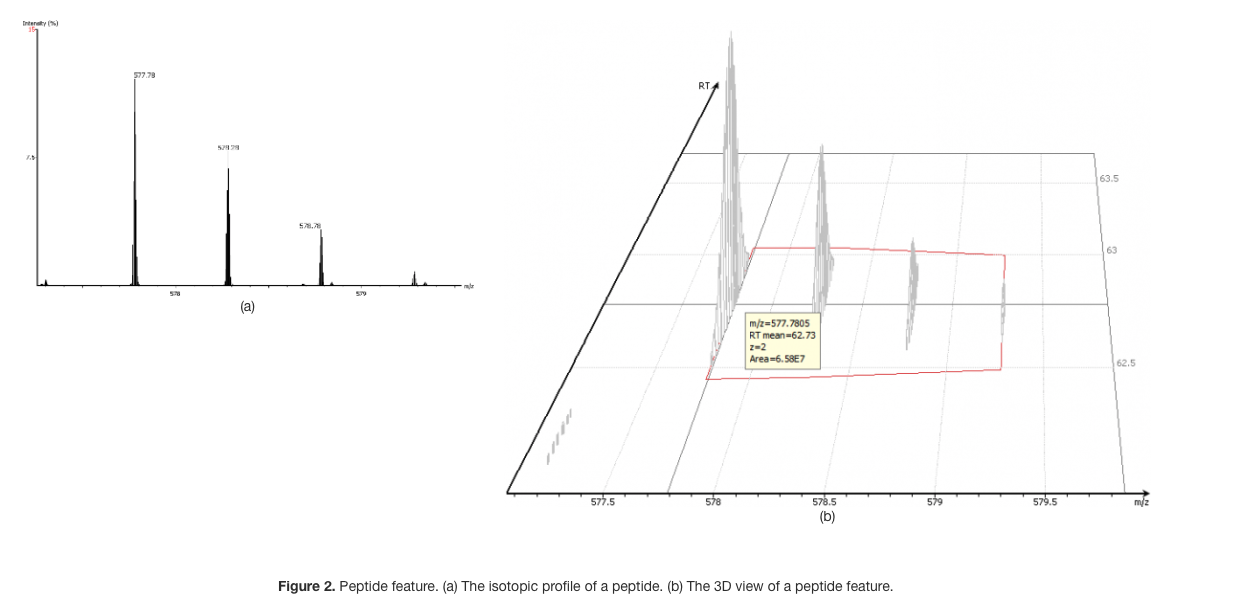
In a typical LC-MS/MS experiment, peptides are eluted from an LC column before detected by a mass spectrometer. At a certain retention time, a peptide can be detected by the mass spectrometer as an isotopic profile (Fig. 2a). As the peptide elutes over time from the column, its peak intensities rise and subsequently fall. Therefore, in a 3D view, a single peptide can be presented as shown in Fig. 2b and we regard these bell-shaped peaks as the feature of the peptide. A peptide feature includes a series of corresponding m/z values, a retention time range, and intensities.
Peptide Feature Area Calculation in PEAKS
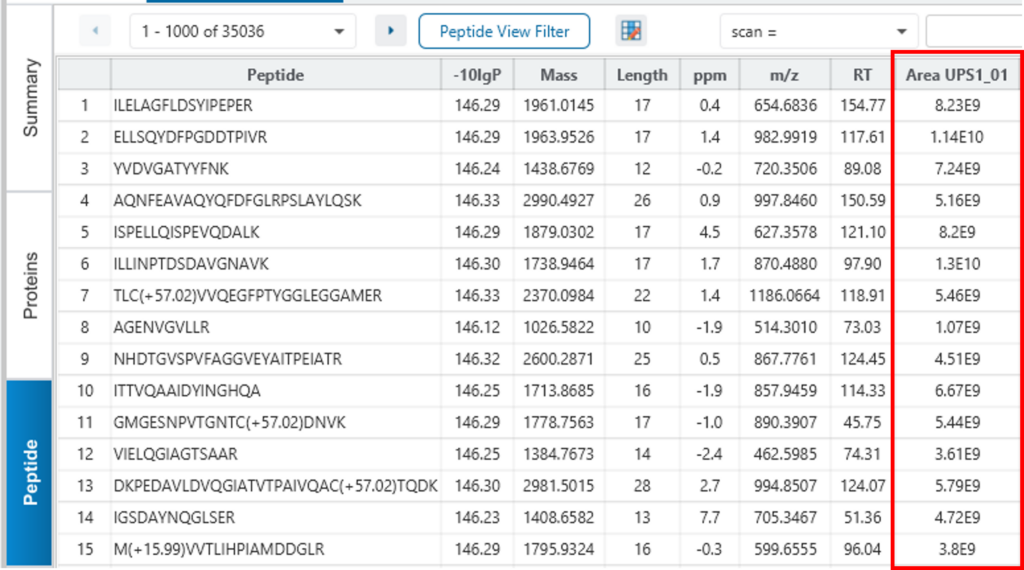
After database search using PEAKS, you may notice the “Area” column (Fig. 1) in the peptide table after opening a database search result. You may also notice this column in PEAKS label-free quantification results. This tutorial is to explain how PEAKS calculates those peptide feature areas.

How does PEAKS Calculate the Area of a Peptide Feature?
Different quantitative tools use different ways to calculate the area of a peptide feature. PEAKS uses a two-step way to calculate the area:
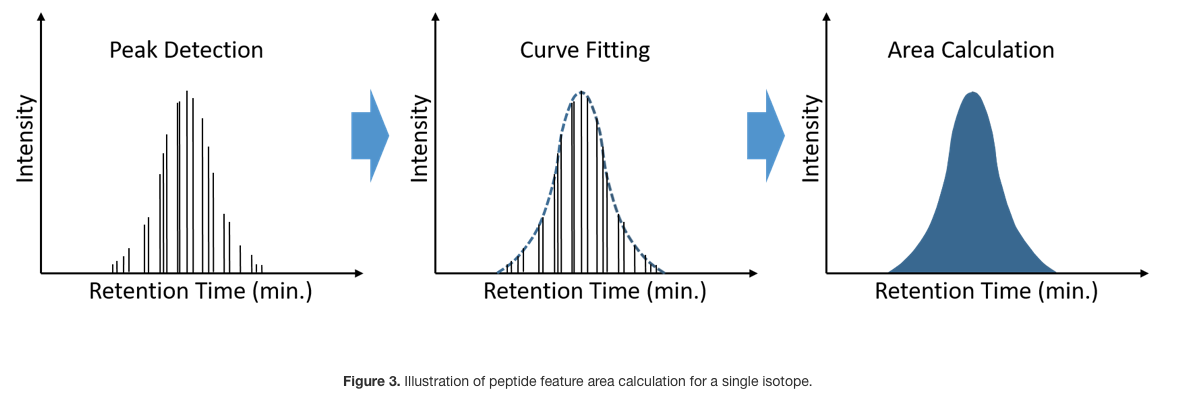
- Draw a curve according to the peptide elution or each isotopic peak and then calculate the area under the curve. Note that PEAKS uses minute as the unit when calculating the area under the curve. (Fig. 3)
- Sum up the area of each isotope. PEAKS users can customise the maximum number of isotopic peaks considered in the area calculation.


