Automated Quality Control (QC) Tool

LC-MS based protein/peptide identification and quantification have become an indispensable tool for proteomics, physiopathology/pharmaceutical studies, and even clinical trials. However, the growing complexity of data from new instrumentation methods and technologies also creates multiple potential sources of variation. These variations can be further amplified with sample size increment, i.e., over 50 samples per group are often necessary due to the high interindividual variation in clinical research. All these elements require researchers to spend more energy in QC steps, and it often becomes a tedious and time-consuming step in research projects.
Key Features
- Integration of database search, quantification, and QC analysis in one workflow
- Statistical analyses are summarised into one report
- Export of data and figures
To overcome the challenge of efficiently assessing data quality, PEAKS 11 has an automated QC tool for protein/peptide identification and quantification workflows. The QC function is easy to set up and can provide sophisticated and systematic QC analysis. The user-friendly interface summarises statistical analyses into one report. All data and figures can be exported based on the user’s needs.
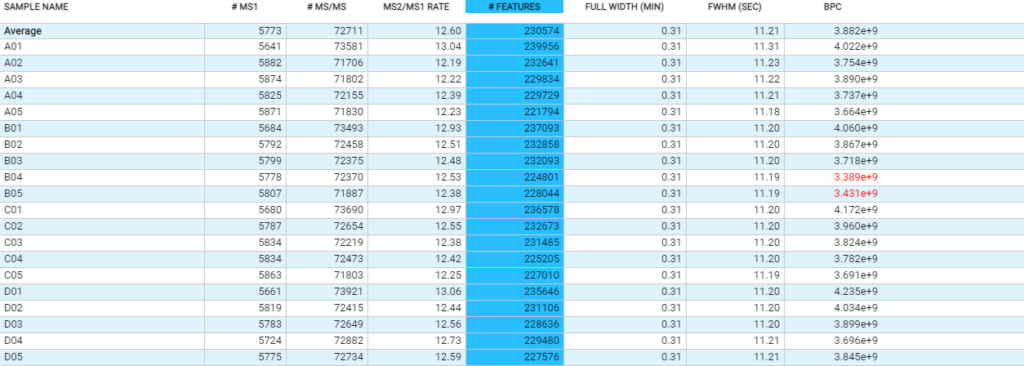
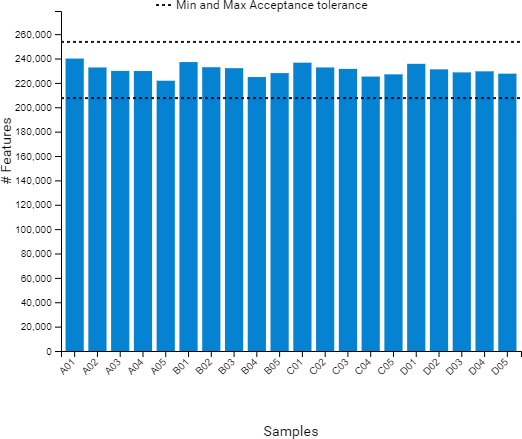
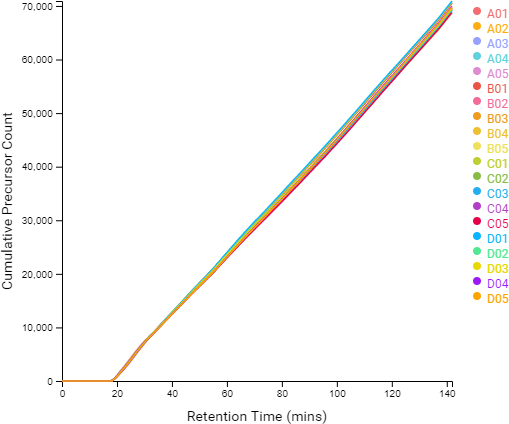
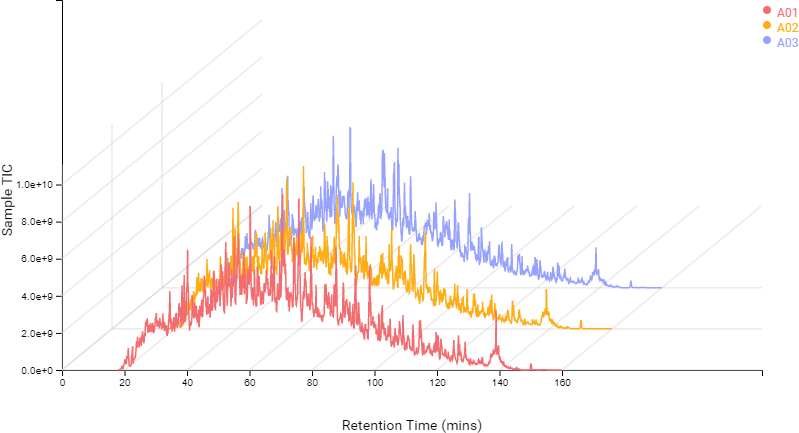
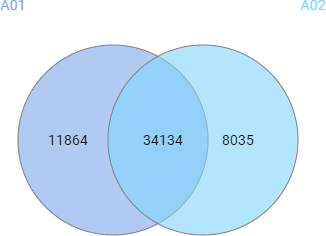
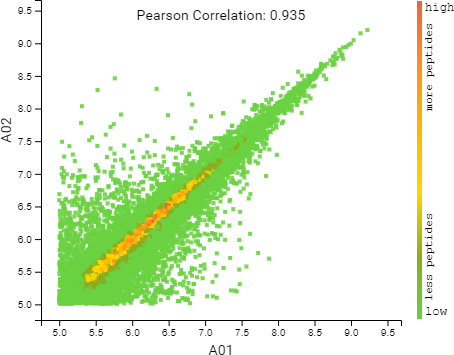
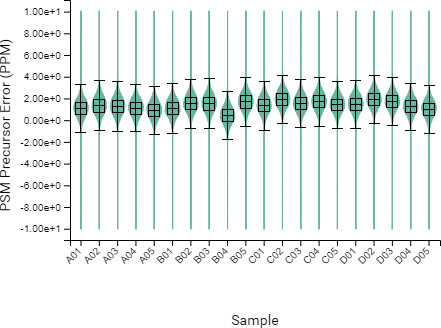
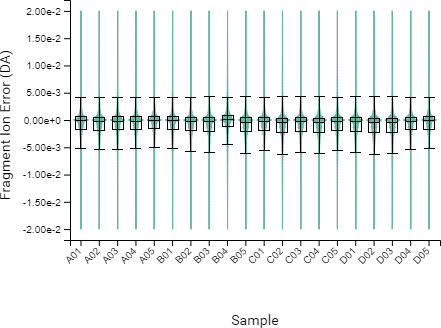
Compared to the summary page from the database search of quantification results, the QC module in PEAKS 11 provides more metrics to assess the quality of each LC-MS run. The QC summary page table provides an overview of MS and LC performance data for each sample run. Users can select different attributes to be plotted in a bar graph with preset min and max tolerance shown. An additional precursor vs retention time plot, named cumulative precursor count, is provided for evaluating peptide separation by LC. Researchers can use this information to fine-tune LC gradient, monitor column lifetime and perform troubleshooting. In the DB search/LFQ QC table, the number of identified/quantified peptide and protein numbers are shown along with other metrics such as scan numbers, PSM numbers, ID rate, etc. A number of figures for assessing data reproducibility are provided such as, Venn diagrams, Pearson correlations, and precursor and fragment ion mass error Violin plots. Venn diagrams and Pearson correlation plots can be generated for any two samples selected.
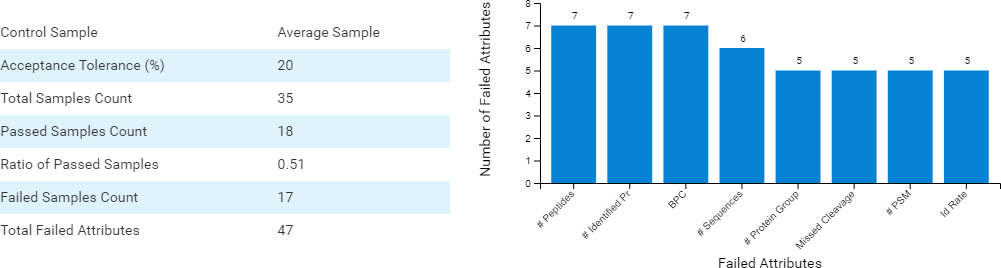
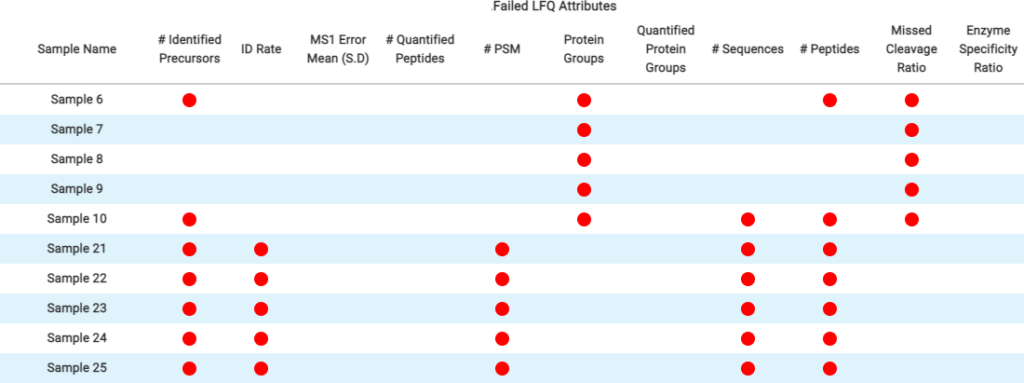
In DIA acquisition, more stringent QC may be needed to compensate for the complexity in MS2 spectra. Therefore, PEAKS 11 provides a customised QC filter to select multiple QC attributes and remove unsuccessful/low-quality runs. All attributes not passing the user-set threshold are categorised and summarised into charts. Thus, the user can quickly determine which attributes in specific runs have failed and decide on a follow-up solution.
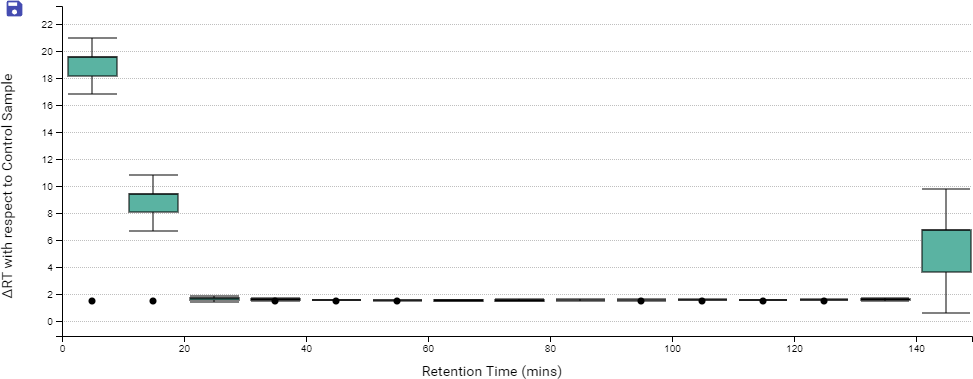
DIA QC workflow also has a box plot to display the difference in the elution times of peptides from all samples across the LC gradient, with respect to a specified control sample or the average retention time across all samples.
All mentioned QC analysis result can be exported in either CSV or PDF file.