

PEAKS GlycanFinder is a comprehensive software for in-depth glycoproteomic analysis with glycan structural resolution. It utilises a glycopeptide-based approach to profile the glycoproteins from LC-MS/MS data. PEAKS GlycanFinder integrates glycan database search and glycan de novo sequencing [1] to facilitate the identification and quantification of N- and O-linked glycans. Deep learning-based algorithms are developed to resolve the ambiguity of glycosylation sites and glycan structures.
Key Features
- Both N-linked and O-linked glycan profiling with structural resolution
- Panorama profiling of glycosylation sites with multiple enzyme digests
- Glycopeptide quantitative analysis with label-free and labelling methods
- Glycan de novo sequencing for finding unknown glycans
- Intuitive Graphical User Interface (GUI) for visualisation, easy validation and reporting
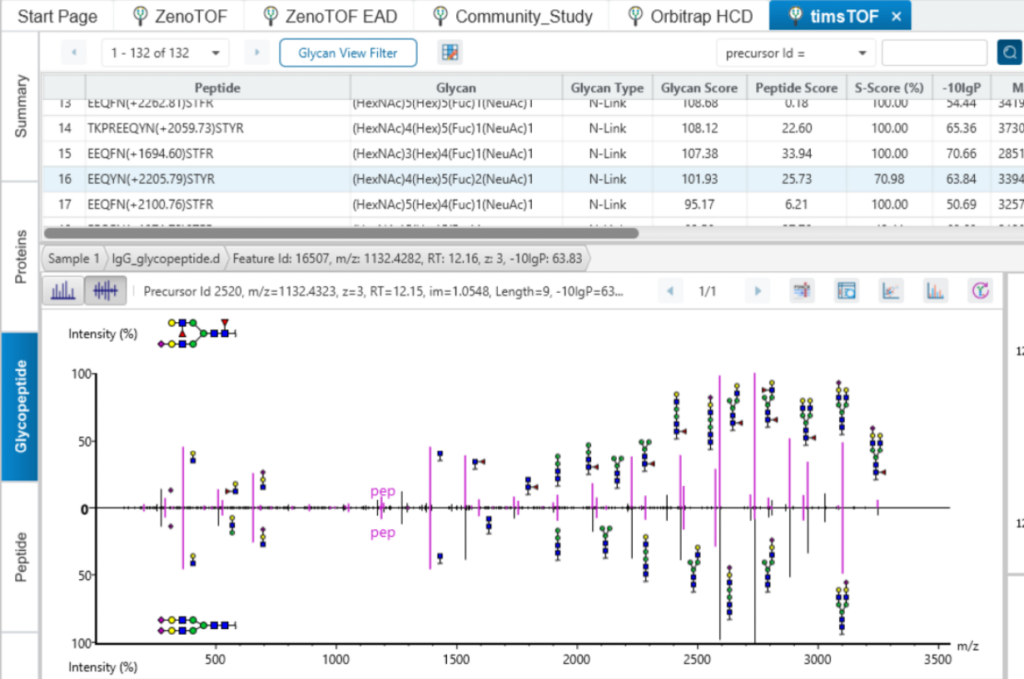
- Support of Orbitrap, timsTOF and ZenoTOF data
Contact us to add PEAKS GlycanFinder to your research
Protein Glycosylation
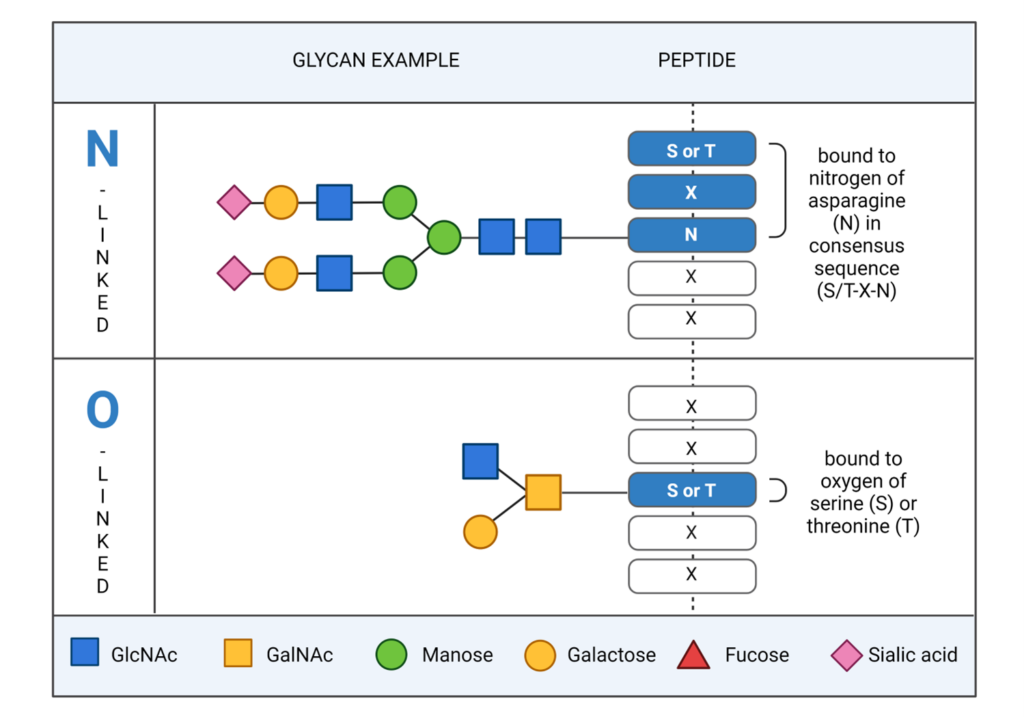
Protein glycosylation, the attachment of sugar moieties or glycans to organic molecules, is one of the most important post-translational modifications that plays a critical function in a wide range of biological processes. It is estimated that above 50% proteins in proteome are glycoprotein. Glycans are a heterogenous group of carbohydrate-based structures that can be linear or branched and are attached to the side chain of amino acids within glycoproteins. The glycans in glycoproteins can be categorised as being N-linked, glycans bound to nitrogen atom of asparagine (N), or O-linked, glycans bound to the oxygen of serine (S) or threonine (T) side chains. Importantly, glycosylation can affect a protein’s structure, stability, and function, and is important for physiological and pathological functions.
Glycoproteomics and Mass Spectrometry
Glycoproteomics involves identifying glycans and the associated glycosylation sites within proteins across the proteome of a given cell or tissue. Fragmentation data from MS/MS spectra are used to identify glycosylation sites and the attached N- or O-linked glycan structures. In the past, LC-MS/MS-based glycoproteomics has been challenged by the macro- and micro-heterogeneity that there may be multiple glycosylation sites per peptide and multiple structures with the same glycan composition.
PEAKS GlycanFinder was designed to handle these challenges. Consensus results from all peptide spectrum matches (PSMs) are used to determine glycosylation sites. With multiple enzyme digestion, PEAKS GlycanFinder provides very accurate profiling of glycosylation sites. In case that multiple glycan candidates match with a spectrum of glycopeptide. A S-Score is assigned to each candidate for structural resolution. In addition, glycan de novo sequencing alleviates the limitations of the incompleteness of the glycan database.
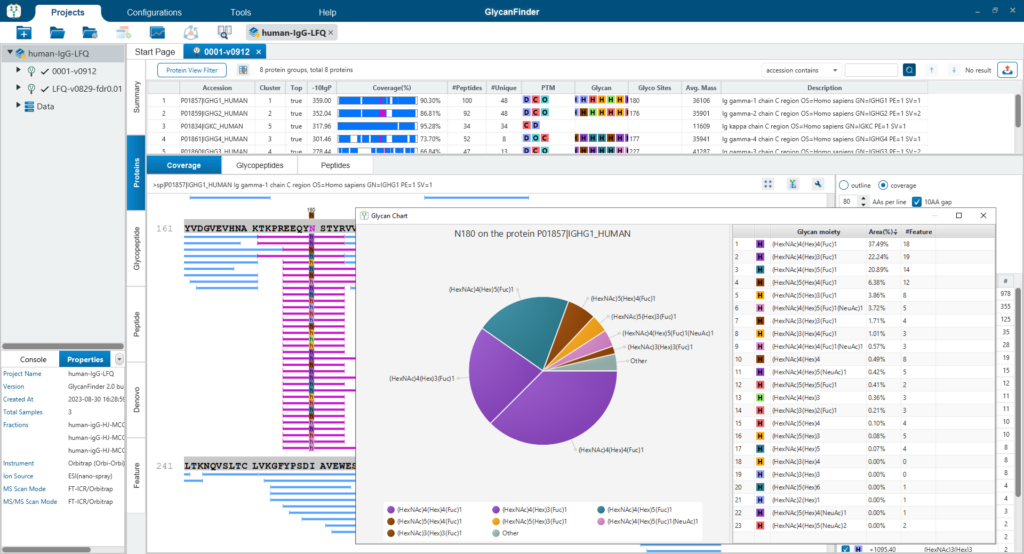
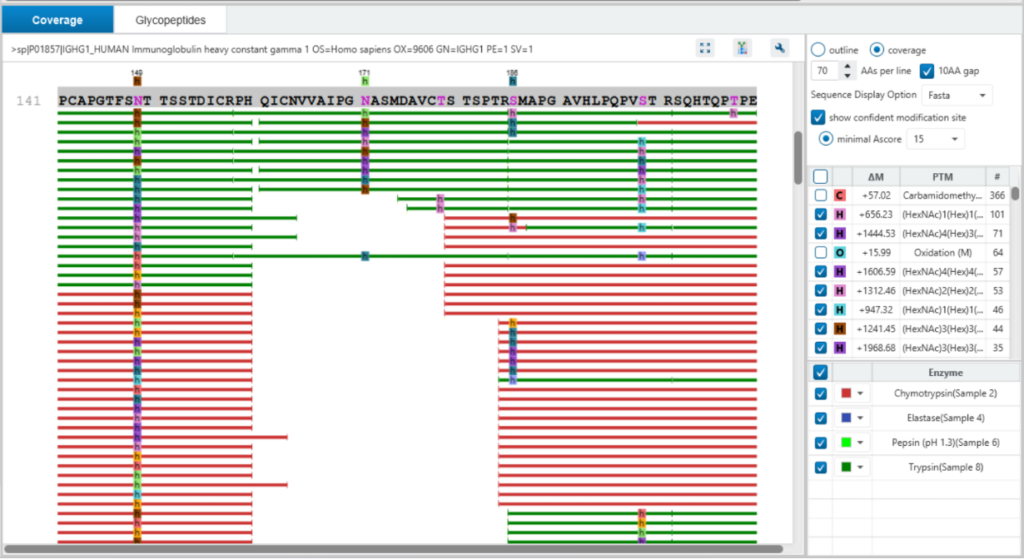
Protein View
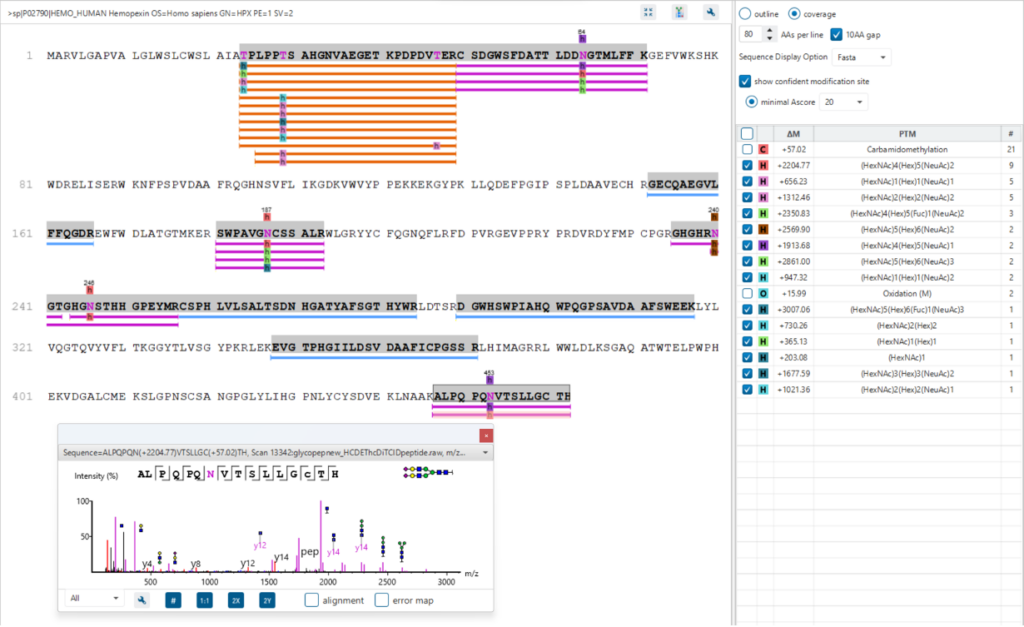
The Protein View presents proteins identified across complex biological samples. For each protein, the sequence coverage view displays the peptide mapping to each protein and is interactive so the user can view each peptide spectrum. Users can easily view identified peptides in blue, N-linked glycan peptides in purple, and O-link glycan peptides in orange. Clicking on a protein Glycosylation site (N,S,T in purple) a Glycan chart with distribution of glycans in a table format and pie chart will be displayed.
Multi-Level In-Depth Glycan Profiling
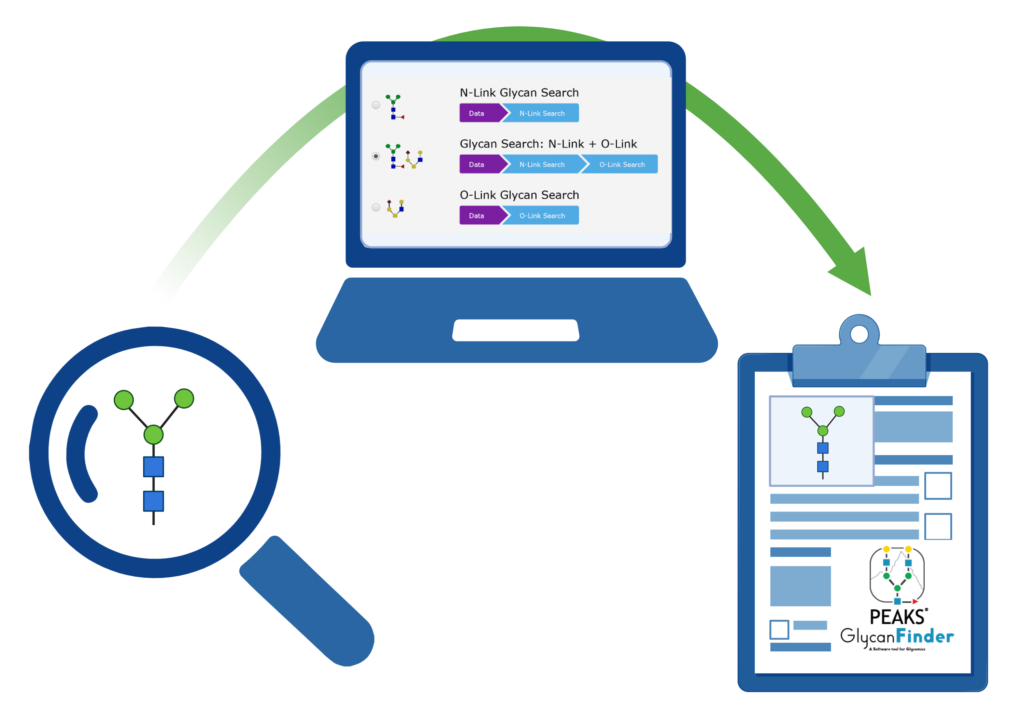
PEAKS GlycanFinder provides two kinds of workflows to analyse glycoproteomics. There are identification and quantification workflows available including, Glycan Site Profiling and Glycan Sample Profiling.
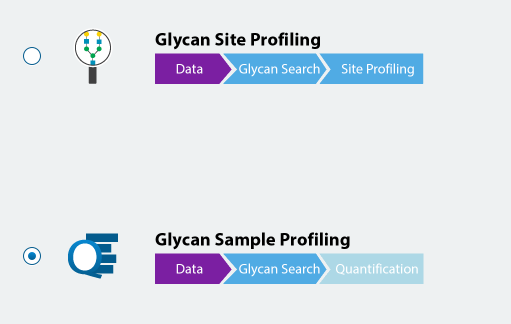
Site Profiling Workflow
Multiple enzyme digests reveal the details of glycan profiling in each glycosylation site. For each site, present the best profiling among all enzymes.
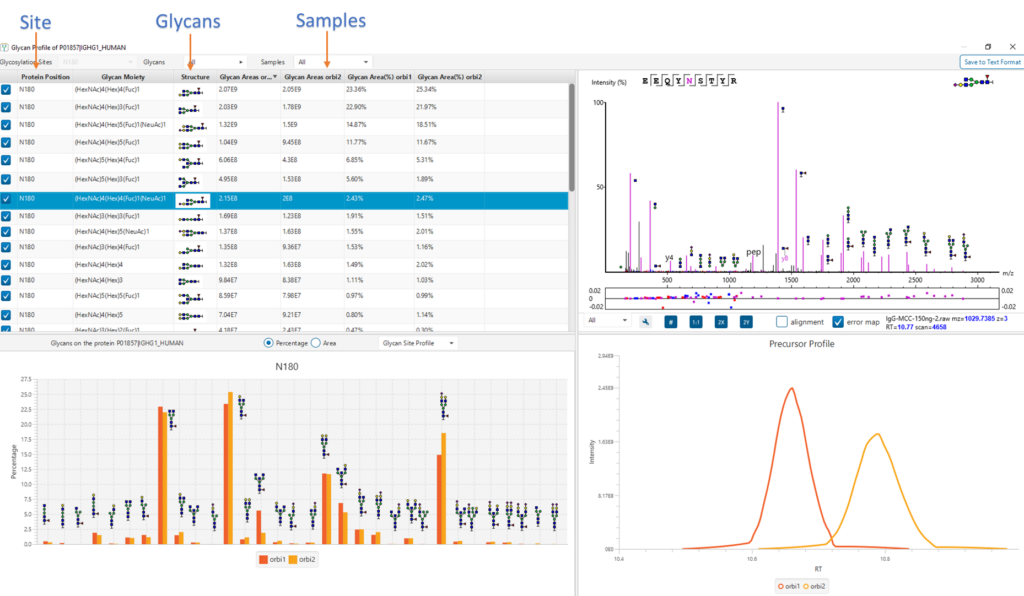
Sample Profiling Workflow
Using sample profiling workflow obtains positional profiling of a protein and compares glycopeptide abundances across samples by label-free and labelled quantification
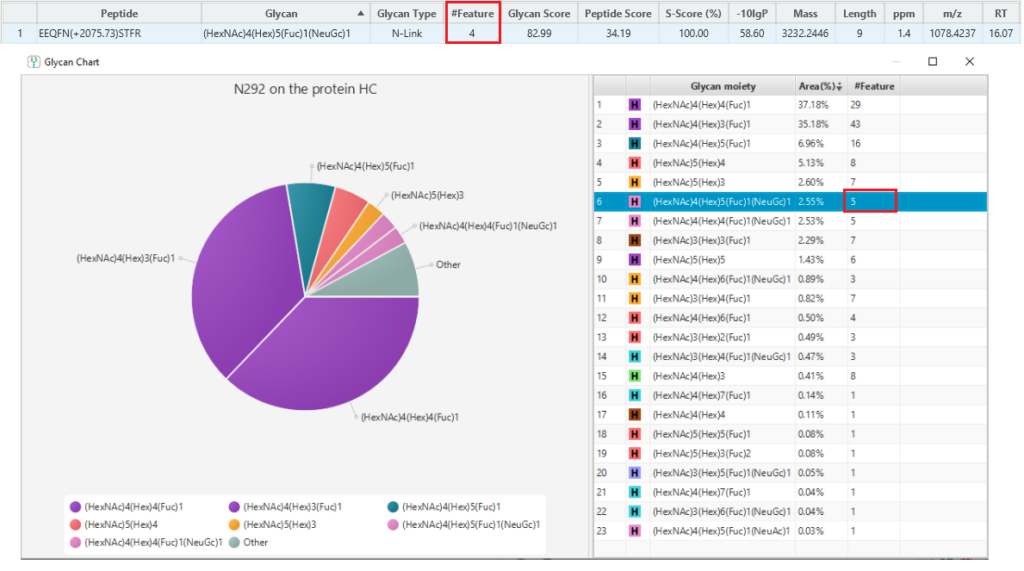
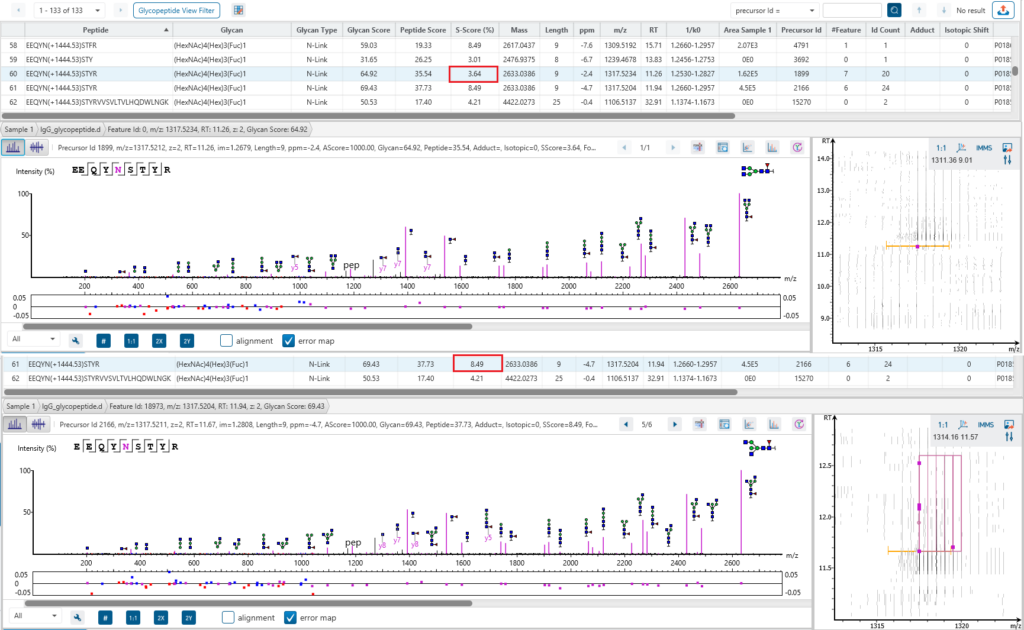
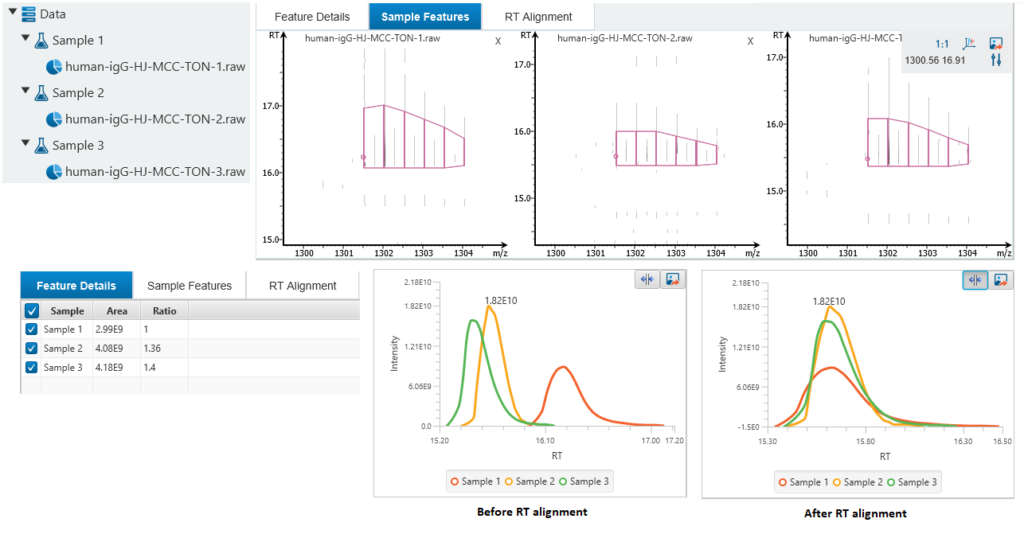
Charge Lookup
A peptide often produces several precursors with different charges, and not all the precursors could be identified. Normally, a peptide feature area is the sum of its all identified precursor areas. This will affect glycan profiling based on glycopeptide feature areas. To calculate the peptide feature area more accurately, a charge lookup is applied to find the precursors of the same peptide without identification. Then, the sum of all precursor feature areas is used for glycan profiling. An example is shown in the Figure 6 below, where one feature without identification of the glycopeptide is used for glycan profiling.
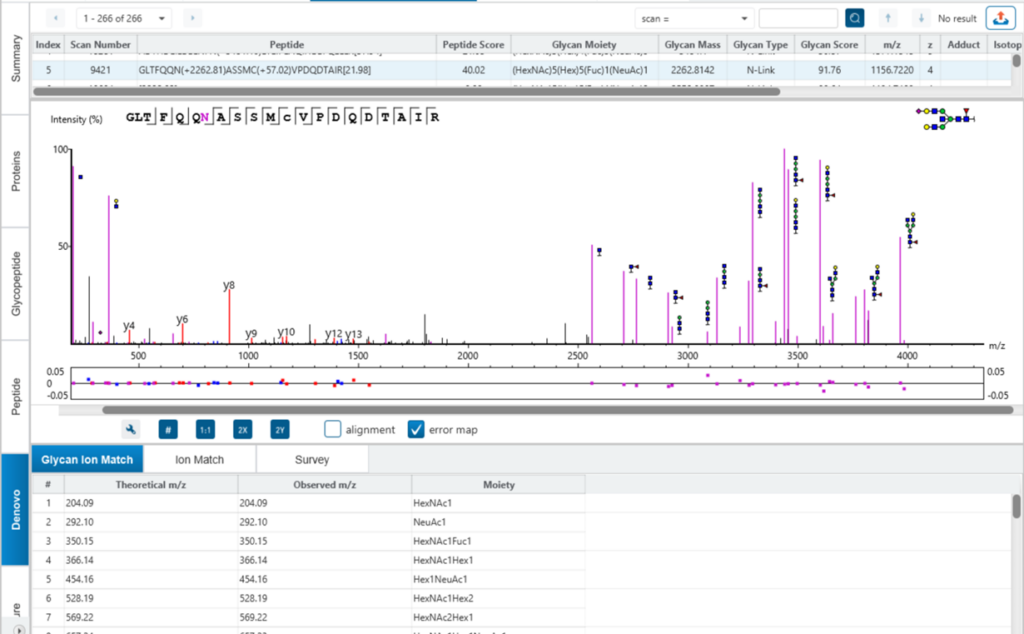
Glycopeptide View
In PEAKS GlycanFinder, it provides two kinds of spectrum view for the glycopeptide. Using the spectrum annotation mirror plot view to validate the glycan structure.
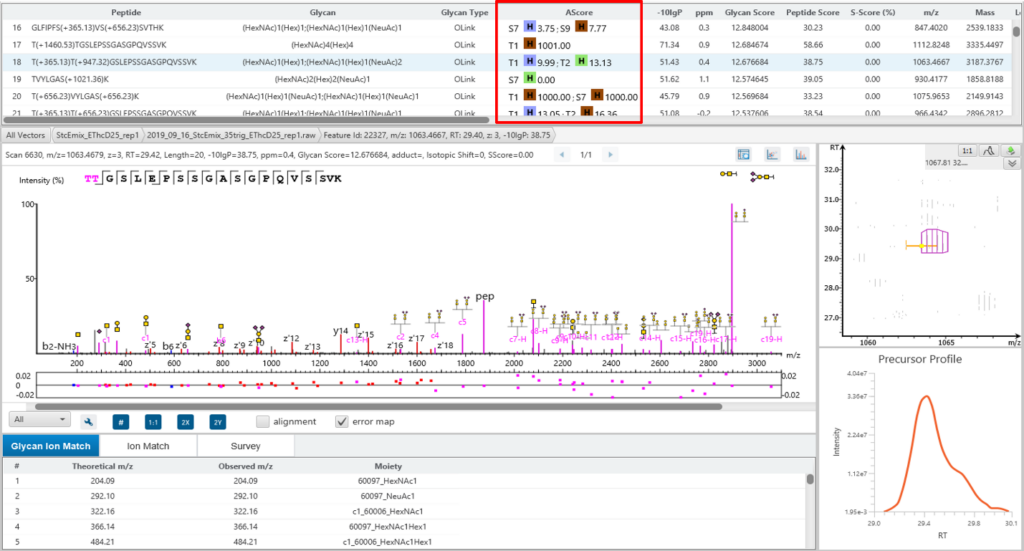
Glycosylation Site Specific Accuracy (A-Score)
PEAKS GlycanFinder uses an A-score, to accurately identify the glycosylation site at the MS/MS level. An A-score calculates an ambiguity score as -10 × log10 P. The p value indicates the likelihood that the glycan site is assigned by chance. Thus, a higher A-score indicates more confidence in the glycan site assignment within a peptide.
Glycan Structure Specificity Matching (S-Score)
The associated glycan on the glycopeptide is given a S-score (%), which indicates the confidence in the matched glycan structure in the glycan database. For glycan candidates in the database with the same composition, the candidate is sorted by matched glycan Y-ion count. S-Score = (most Y-ion count – 2nd most Y-ion count)/(most Y-ion count). The higher the score the better. 100% indicates only 1 result, and it is the best match. 0% indicates that the top1 and top2 results are very similar, and we cannot confidently say the result is the best match.
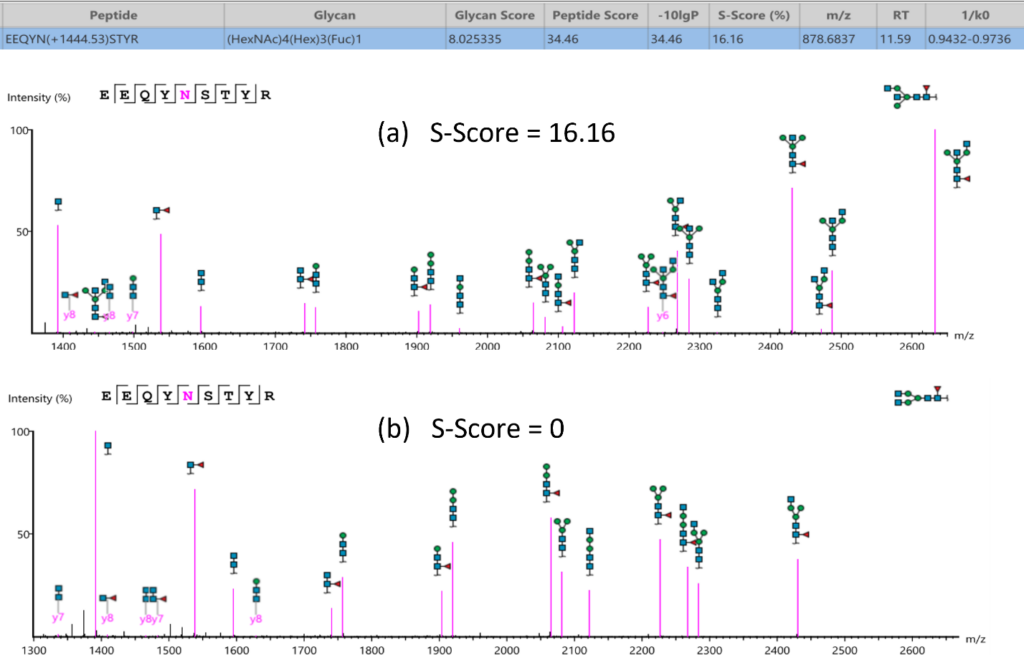
Here is an example of S-score to distinguish two structures with the same composition. GlycanFinder reports two structures in which two features are identified with the same sequence EEQYN(+1444.53)STYR and glycan moiety (HexNac)4(Hex)2(Fuc)1. The mirror plot of GlycanFinder can give the evidence of the signature ion to illustrate which structure glycan can be assigned to this ID result.
Glycan de novo
When the glycan database is incomplete, or there are some unexpected modifications, PEAKS GlycanFinder de novo algorithm will provide extra glycopeptide identifications.
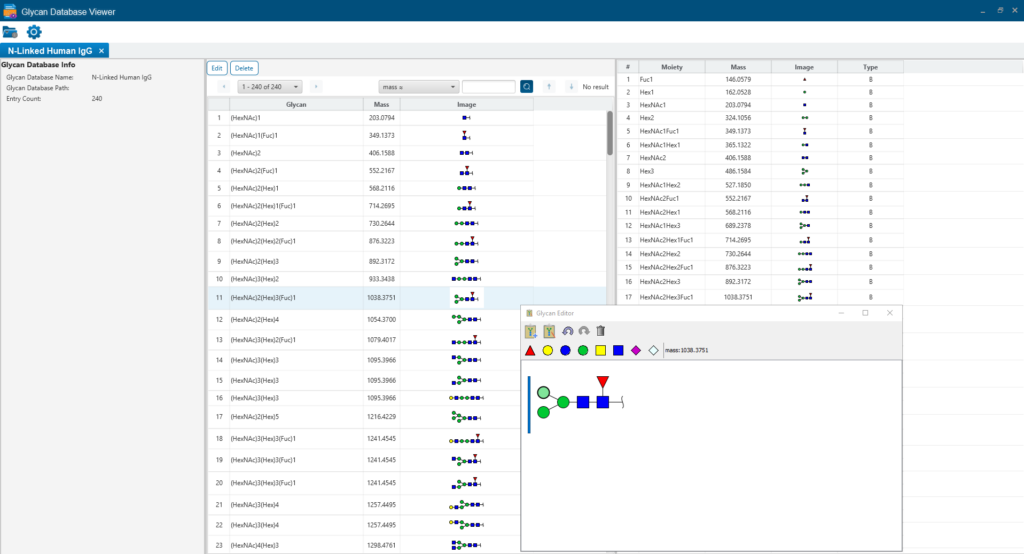
Glycan Database Editor
Glycan database editor tool helps to build your own glycan database, users can edit and modify the glycan database through a drawing board, and easily configure it into the software. It also provides the fragment ion information of glycans.
Glycoprotemics Quantification with Label Free (LFQ) and Labelled Methods
It is essential to know the change of the glycosylation in glycoproteome, as it helps us to understand the biological processing regulated by glycoproteins. In PEAKS GlycanFinder, it supports label free and labelled quantification methods.
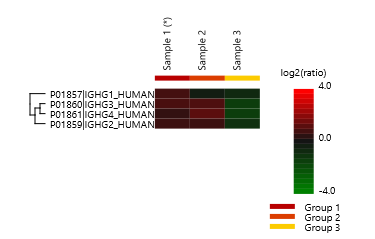
Label Free Quantification
PEAKS GlycanFinder provides LFQ workflow to examine the relative abundance of proteins, including glycoproteins. The quantification is based on the relative abundance of peptide features detected in multiple samples. Features of the same peptide from different samples are reliably aligned together via matched between runs.
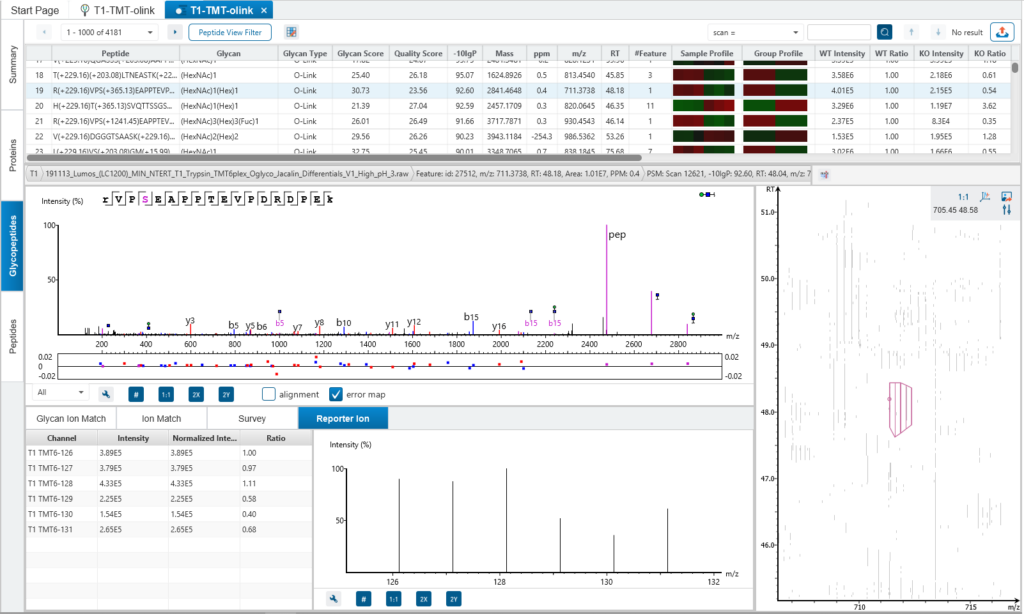
Labelled Quantification
In contrast to LFQ, TMT/iTRAQ Quantification is based on the relative intensities of report ions at fixed m/z values within an MS2 (or MS3) spectrum.
The same peptides from different samples will have the same precursor m/z and retention time, and are fragmented together. In the MS2 (or MS3) scans, labels from different samples will produce different reporter ions, which can then be used to calculate the quantification ratio between samples. Both user-defined and commercial labels (i.e. iTRAQ and TMT) are supported by PEAKS GlycanFinder.
Configuration
PEAKS GlycanFinder is to be installed on 64-bit Windows operating system (Windows 10 or later). PEAKS GlycanFinder program files will use ~5GB disk space and will require extra disk space for storing temporary files and intermediate results.
The two main factors affecting PEAKS GlycanFinder’s performance are CPU and RAM. The minimum recommended and ideal hardware requirements are as follows:
- Recommended minimum: Intel Core i7/i9/Xeon processors or AMD Ryzen processors with a total of 32 threads or more, and 64 GB of RAM or more.
- To perform N+O Glycan search on large TimsTOF datasets and large FASTA databases: more than 32 CPU threads and 128 GB of RAM or more.
References & Resources
References
- Sun, W., Zhang, Q., Zhang, X. et al. Glycopeptide database search and de novo sequencing with PEAKS GlycanFinder enable highly sensitive glycoproteomics. Nat Commun 14, 4046 (2023). https://doi.org/10.1038/s41467-023-39699-5