PEAKS Glycan Analysis

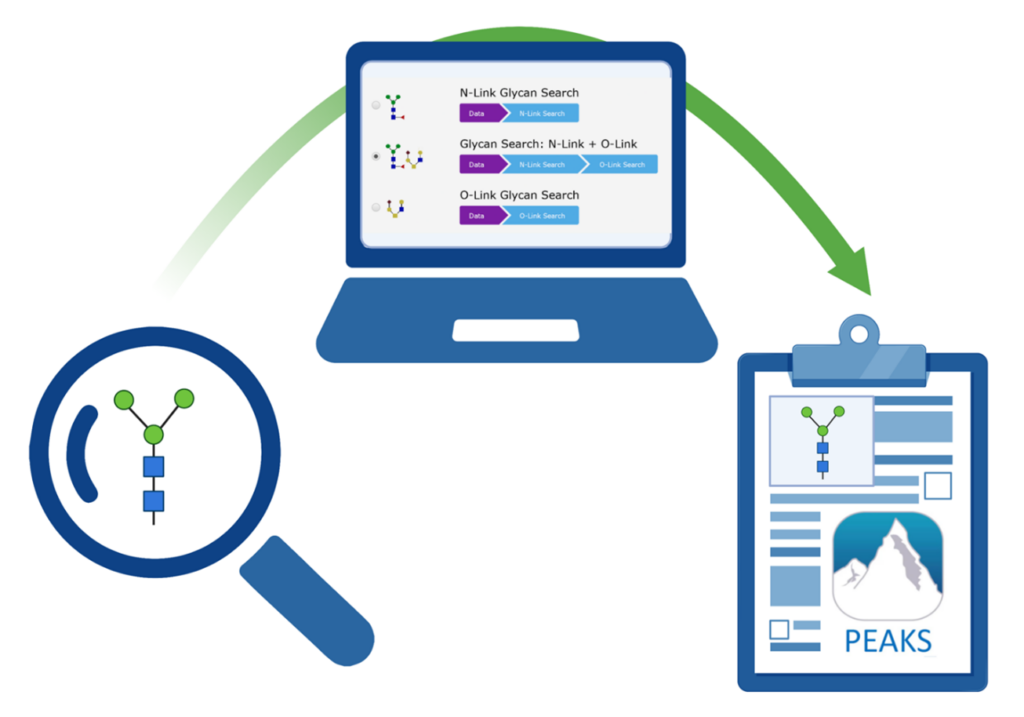
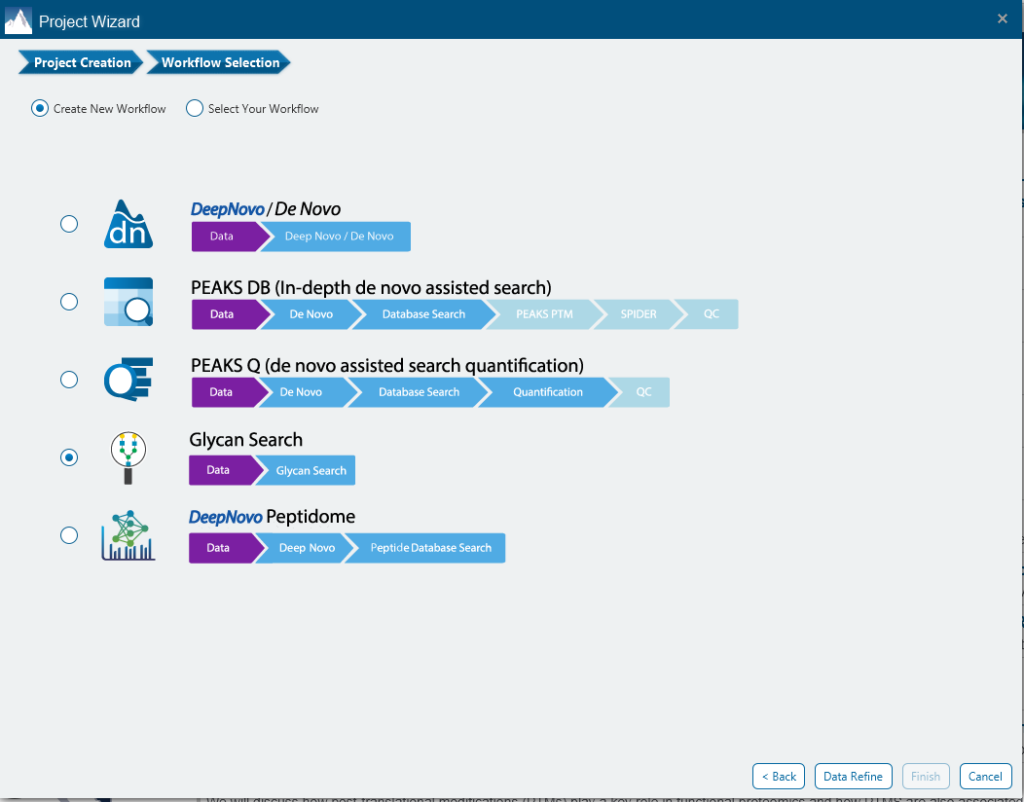
PEAKS Glycan analysis in PEAKS Studio provides a unique solution for in-depth Glycoproteomic analysis. PEAKS Glycan utilises a glycopeptide-based approach to profile the glycoproteins in your sample using LC-MS/MS data. As part of the PEAKS Studio platform, PEAKS Glycan presents a refined database search and newly developed algorithms to facilitate the identification and characterisation of both N- and O-linked glycans. Glycan profiling is done at specific sites within a protein (positional profiling) and compares glycopeptide abundances across samples by label-free quantification. Currently, it supports ThermoFisher and Bruker instruments and includes an easy-to-use project wizard for workflow and analysis parameter selection that will be familiar to all PEAKS users.
Contact us to add PEAKS 11 to your lab!
Protein Glycosylation
Glycosylation, the attachment of sugar moieties or glycans to organic molecules, is one of the most common post-translation modifications (PTM) and plays a critical function in a wide range of biological processes. Glycans are a heterogenous group of carbohydrate-based structures that can be linear or branched and are attached to the side chain of amino acids within glycoproteins. The glycans in glycoproteins can be categorised as being N-linked, glycans bound to nitrogen atom of asparagine (N), or O-linked, glycans bound to the oxygen of serine (S) or threonine (T) side chains. Importantly, glycosylation can affect a proteins structure, stability, and function, and is important for physiological and pathological functions.
Glycoproteomics and Mass Spectrometry
Glycoproteomics involves identifying glycans and the associated glycosylation sites within proteins across the proteome of a given cell or tissue. At the protein level, amino acid sequences, or individual amino acids, are used to predict glycosylation sites. Fragmentation data from MS/MS spectra are used to identify these sites and the attached N- or O-linked glycan structures. In the past, LC-MS/MS-based glycoproteomics has been challenged by complexity of molecules present in a sample, resulting in an extensive search space consisting of all potential peptide sequences, glycans, and other PTMs. PEAKS Glycan was designed to handle these challenges of mass spectrometry glycoproteomics and is a comprehensive data analysis tool that provides a highly sensitive and accurate glycoproteomics software solution.
PEAKS Glycan Workflow
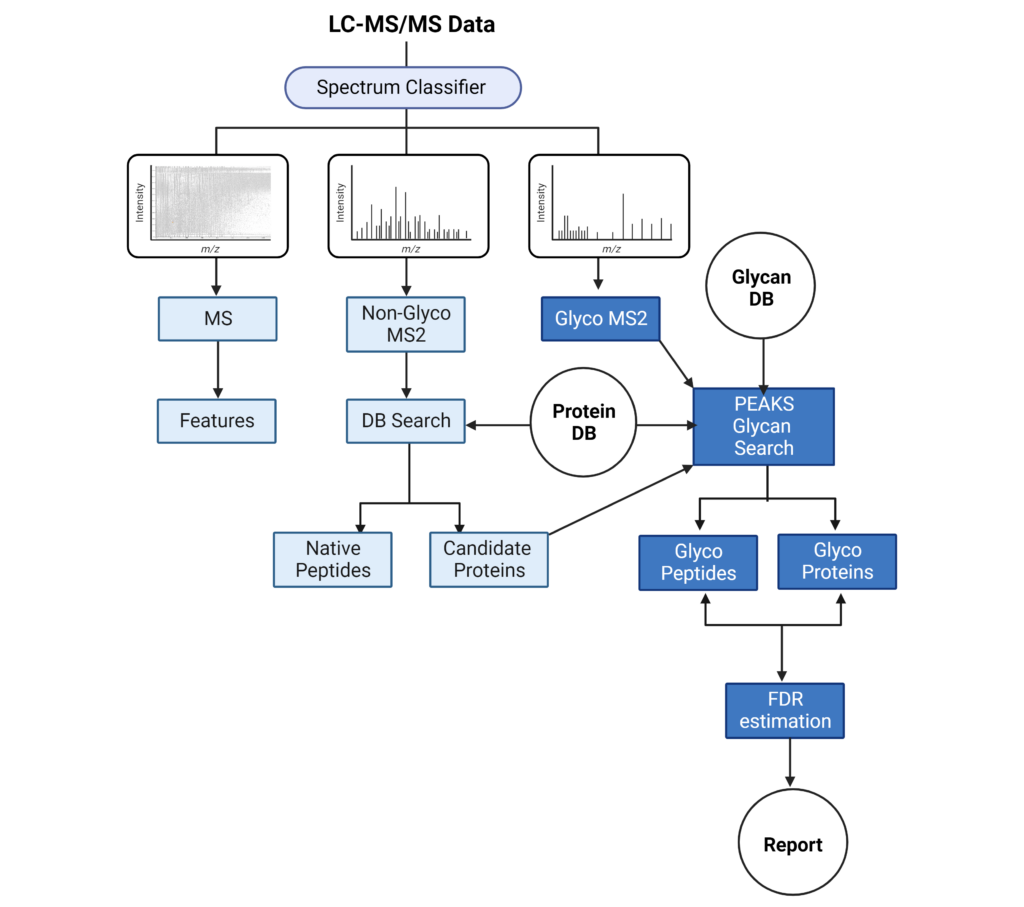
The LC-MS/MS spectrum classifier will separate spectra into MS1, non-Glyco MS2 and Glyco MS2 categories. MS1 scans will be used for feature detection. Non-Glyco MS2 scans will undergo a database (DB) search to identify candidate proteins and peptides. The Glyco MS2 spectra will be searched against a Protein DB and Glycan DB to identify glycans and peptide sequences, which are filtered by a desired false discovery rate (FDR). These results are then reported in the Proteins and Glycopeptide tabs.
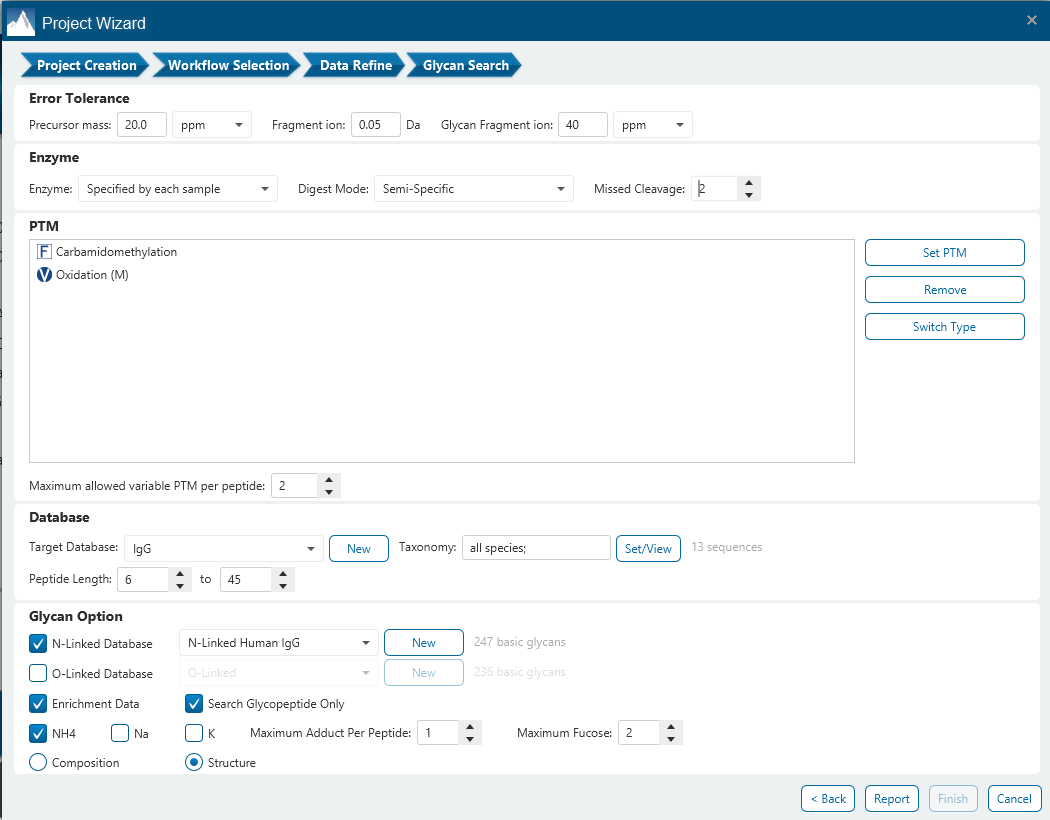
Get important insight of the complete analysis from Search Parameters to Result Summary
The Glycan Search parameters pane is where most of the relevant parameters are set including Enrichment Data, Error Tolerance, Enzyme, Digest Mode, Missed Cleavages and PTMs.
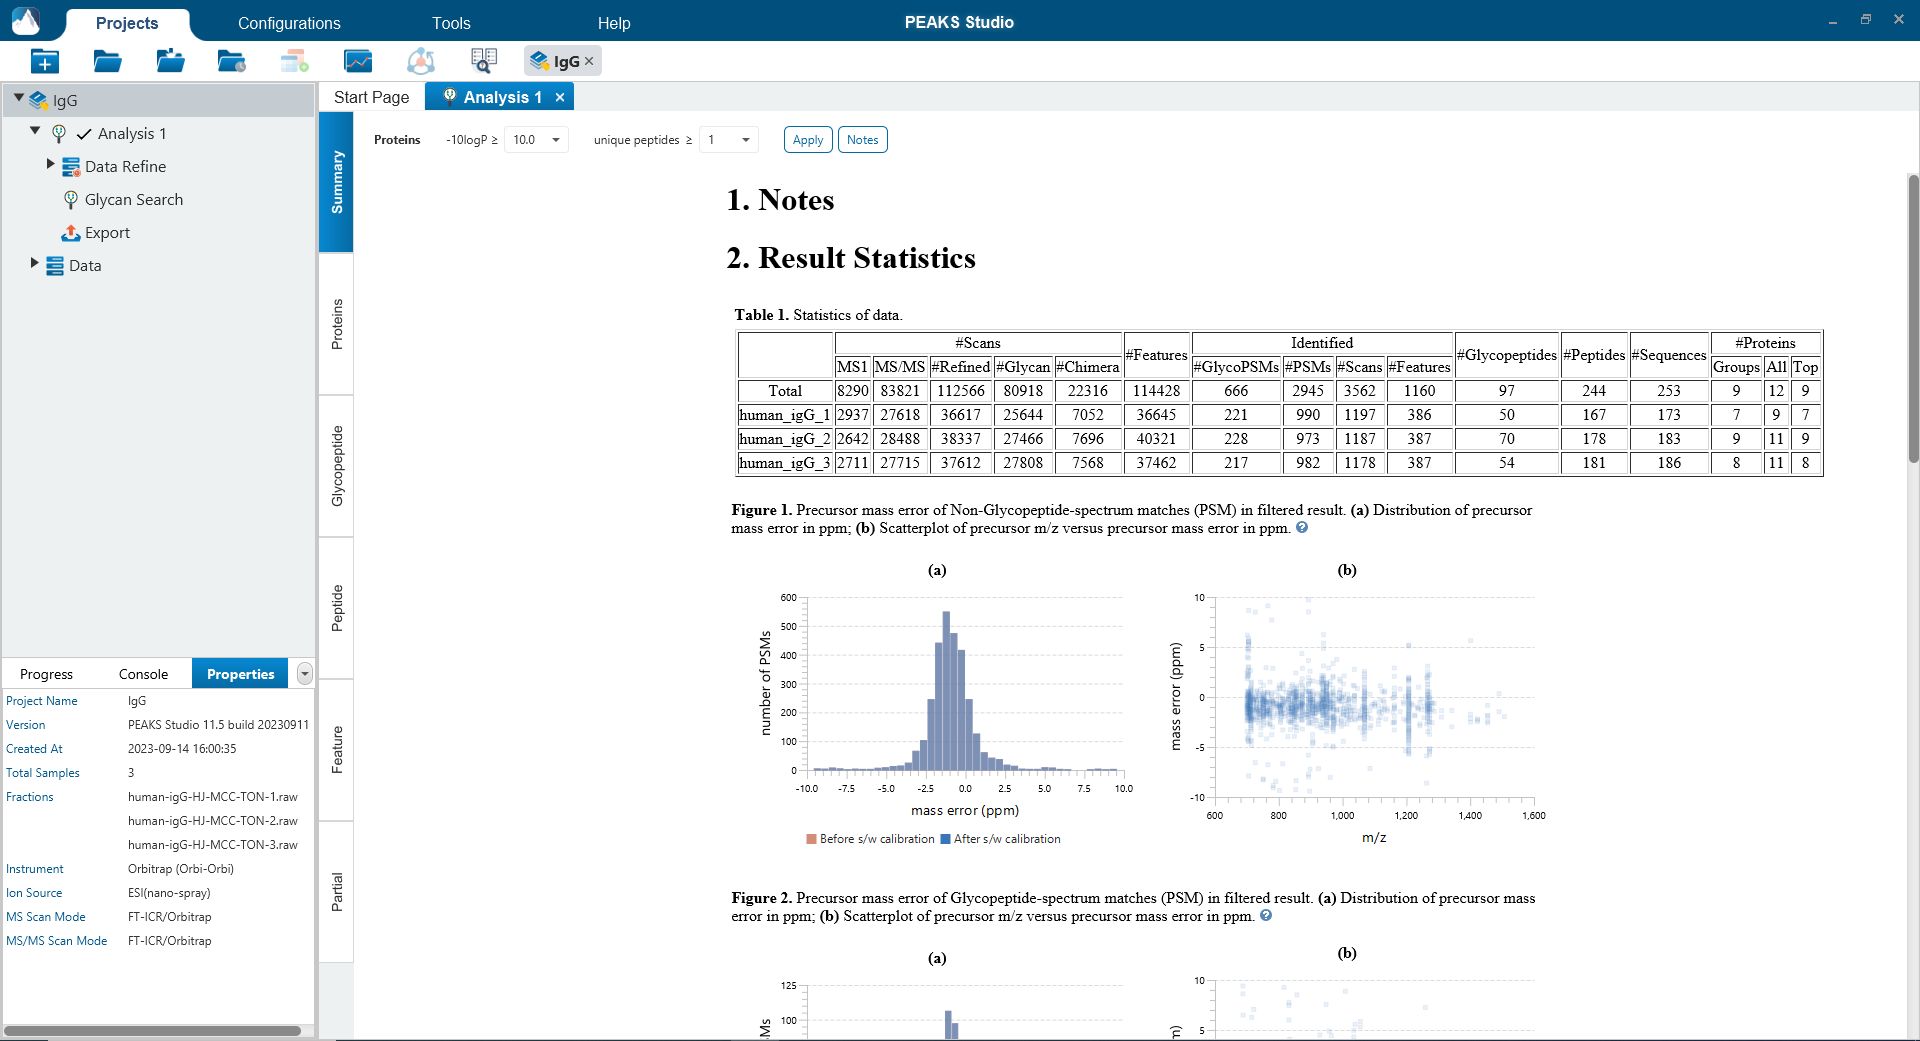
The Summary page provides an overview of the PEAKS Glycan result and the quality of your data. The statistics table and the glycosylation sites table provide a quick summary of the search result for each sample in your experiment.
Protein Coverage
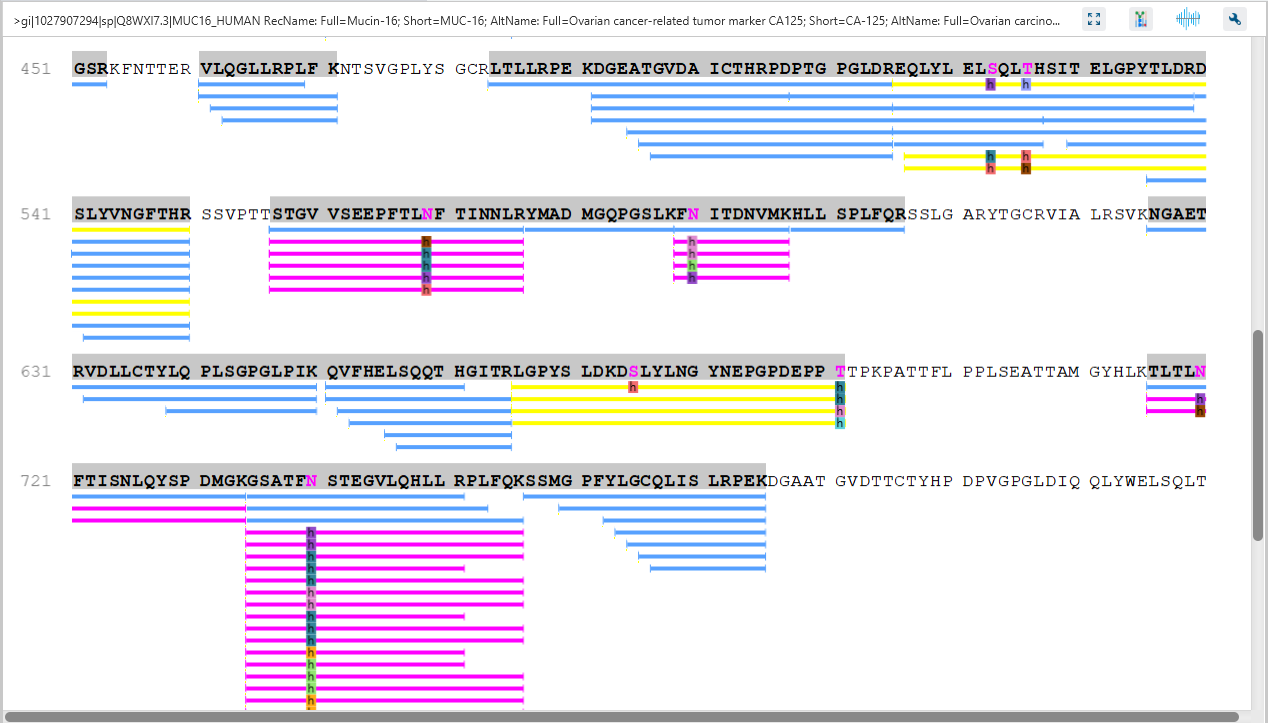
The Protein Coverage view visually maps the supporting peptides and de novo tags to the protein selected in the Protein table. It also shows all identified sites with modifications or mutations to assist with protein characterisation at the amino acid level.
The Protein View presents proteins identified across complex biological samples. For each protein, the sequence coverage view displays the peptide mapping to each protein and is interactive so the user can view each peptide spectrum. Users can easily view identified peptides in blue, N-linked glycan peptides in purple, and O-link glycan peptides in yellow. Clicking on a protein Glycosylation site (N,S,T in purple) a Glycan chart with distribution of glycans in a table format and pie chart will be displayed.
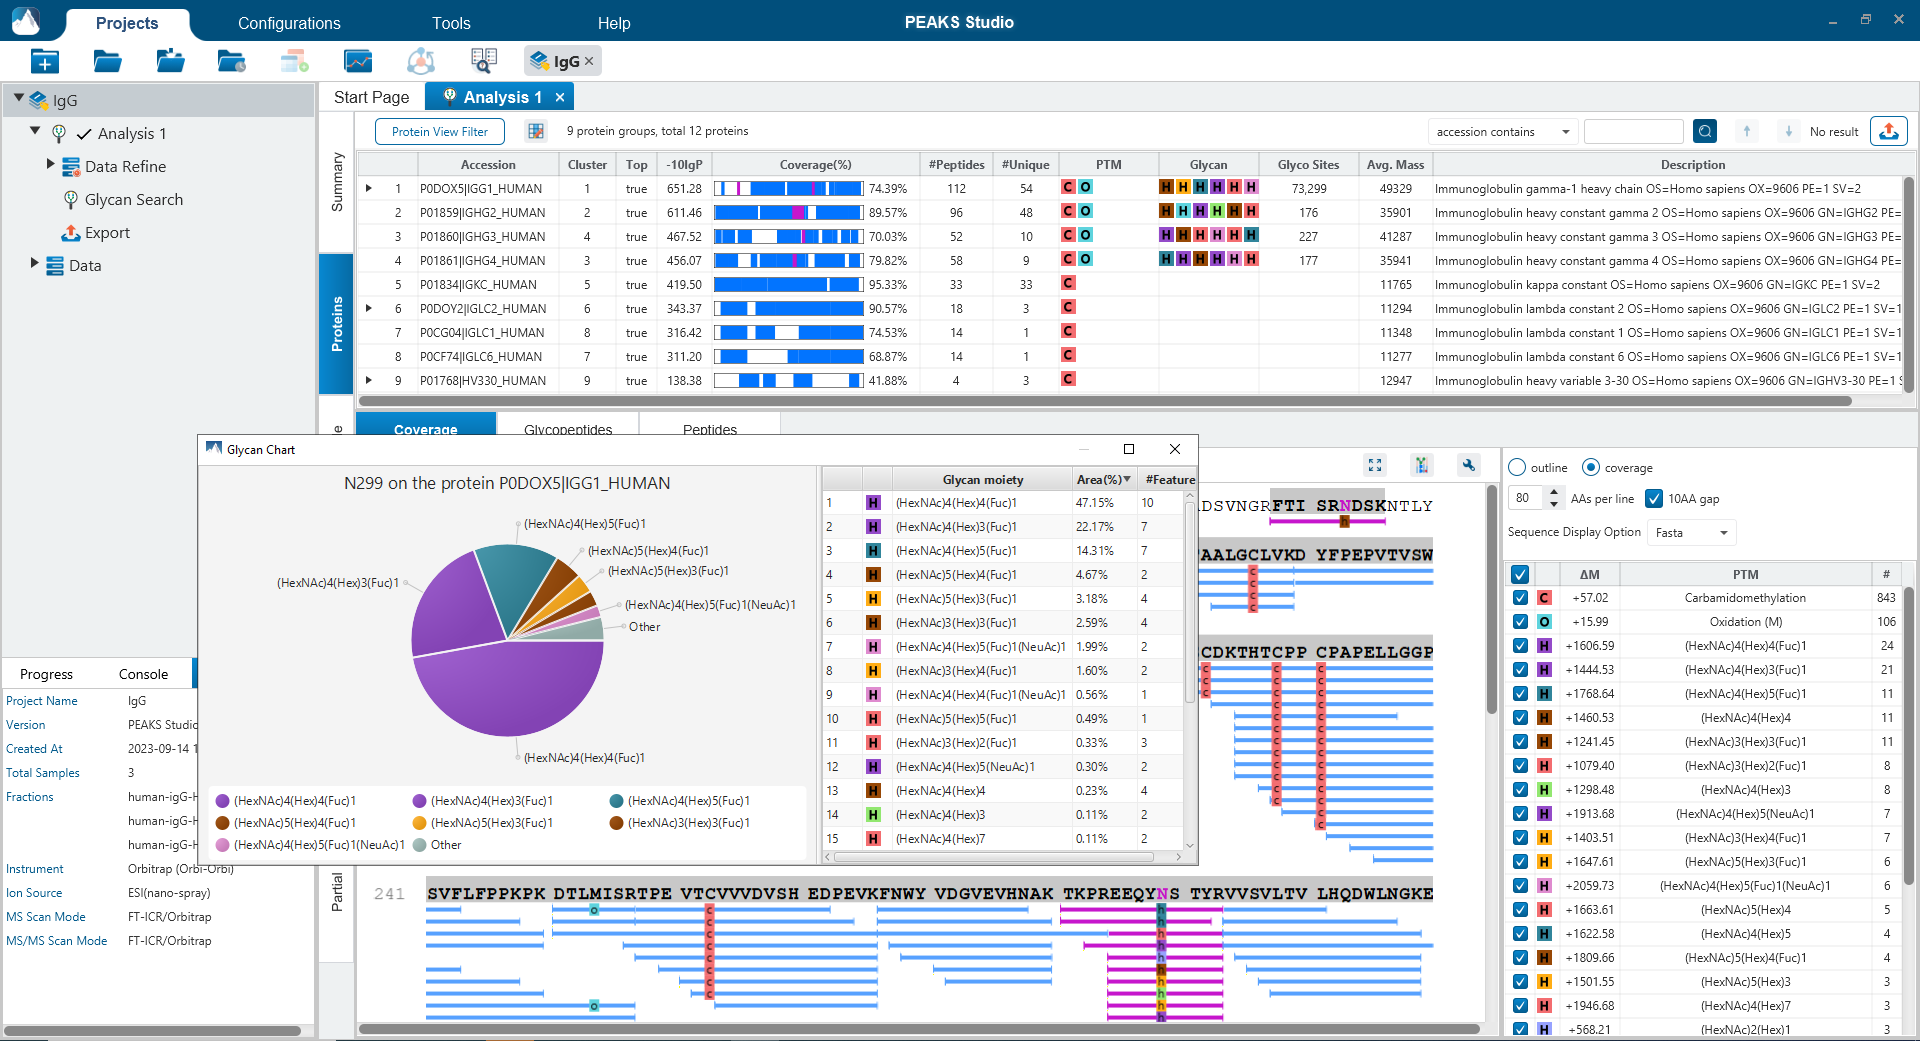
Glycan Profiling
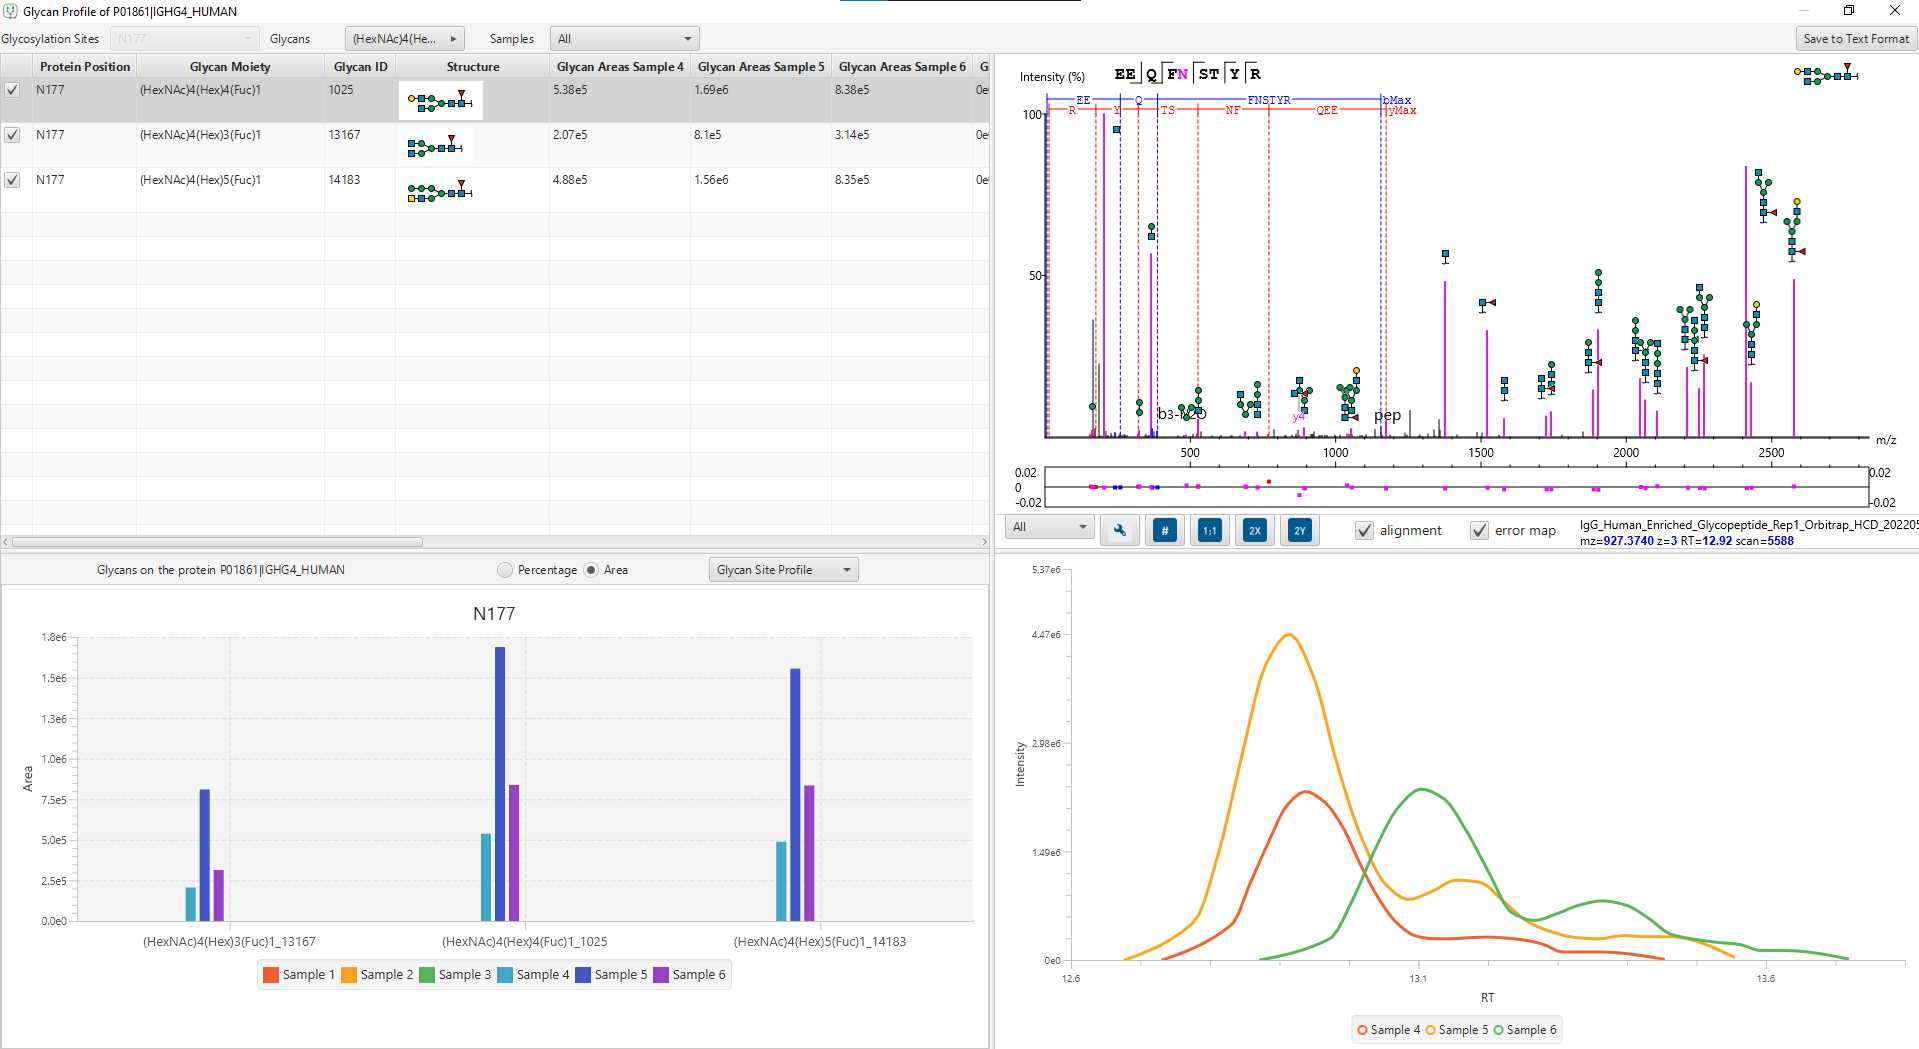
Glycan Profiling feature allows for the visualisation of all glycans detected at each glycosylation site of a protein and the relative glycopeptide abundances across samples. Filter options are provided for customising the view and the glycan profile table and chart can be exported with ease. The Glycan XIC (Extracted Ion Chromatogram) chart shows the combined XIC of glycans for each of the selected samples. The Glycan Site Profile shows a bar chart of the area distribution between samples of each glycan moiety.
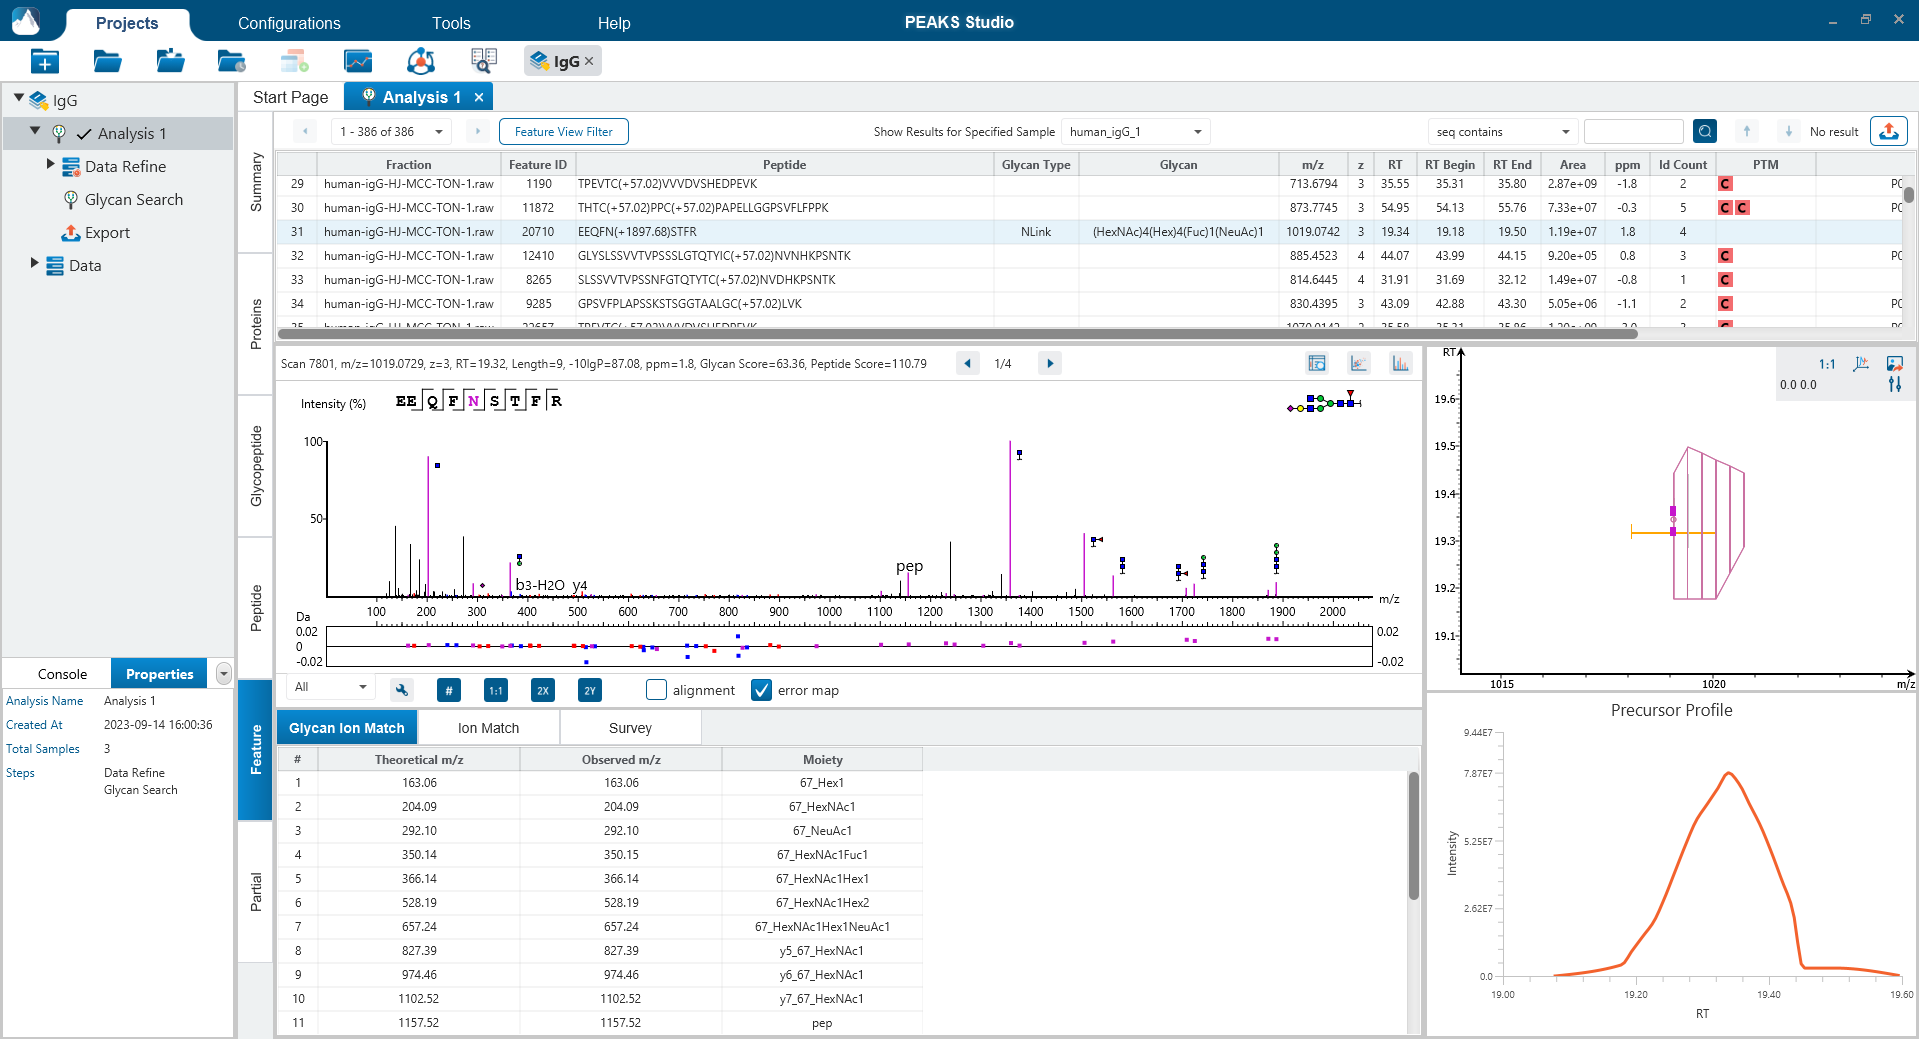
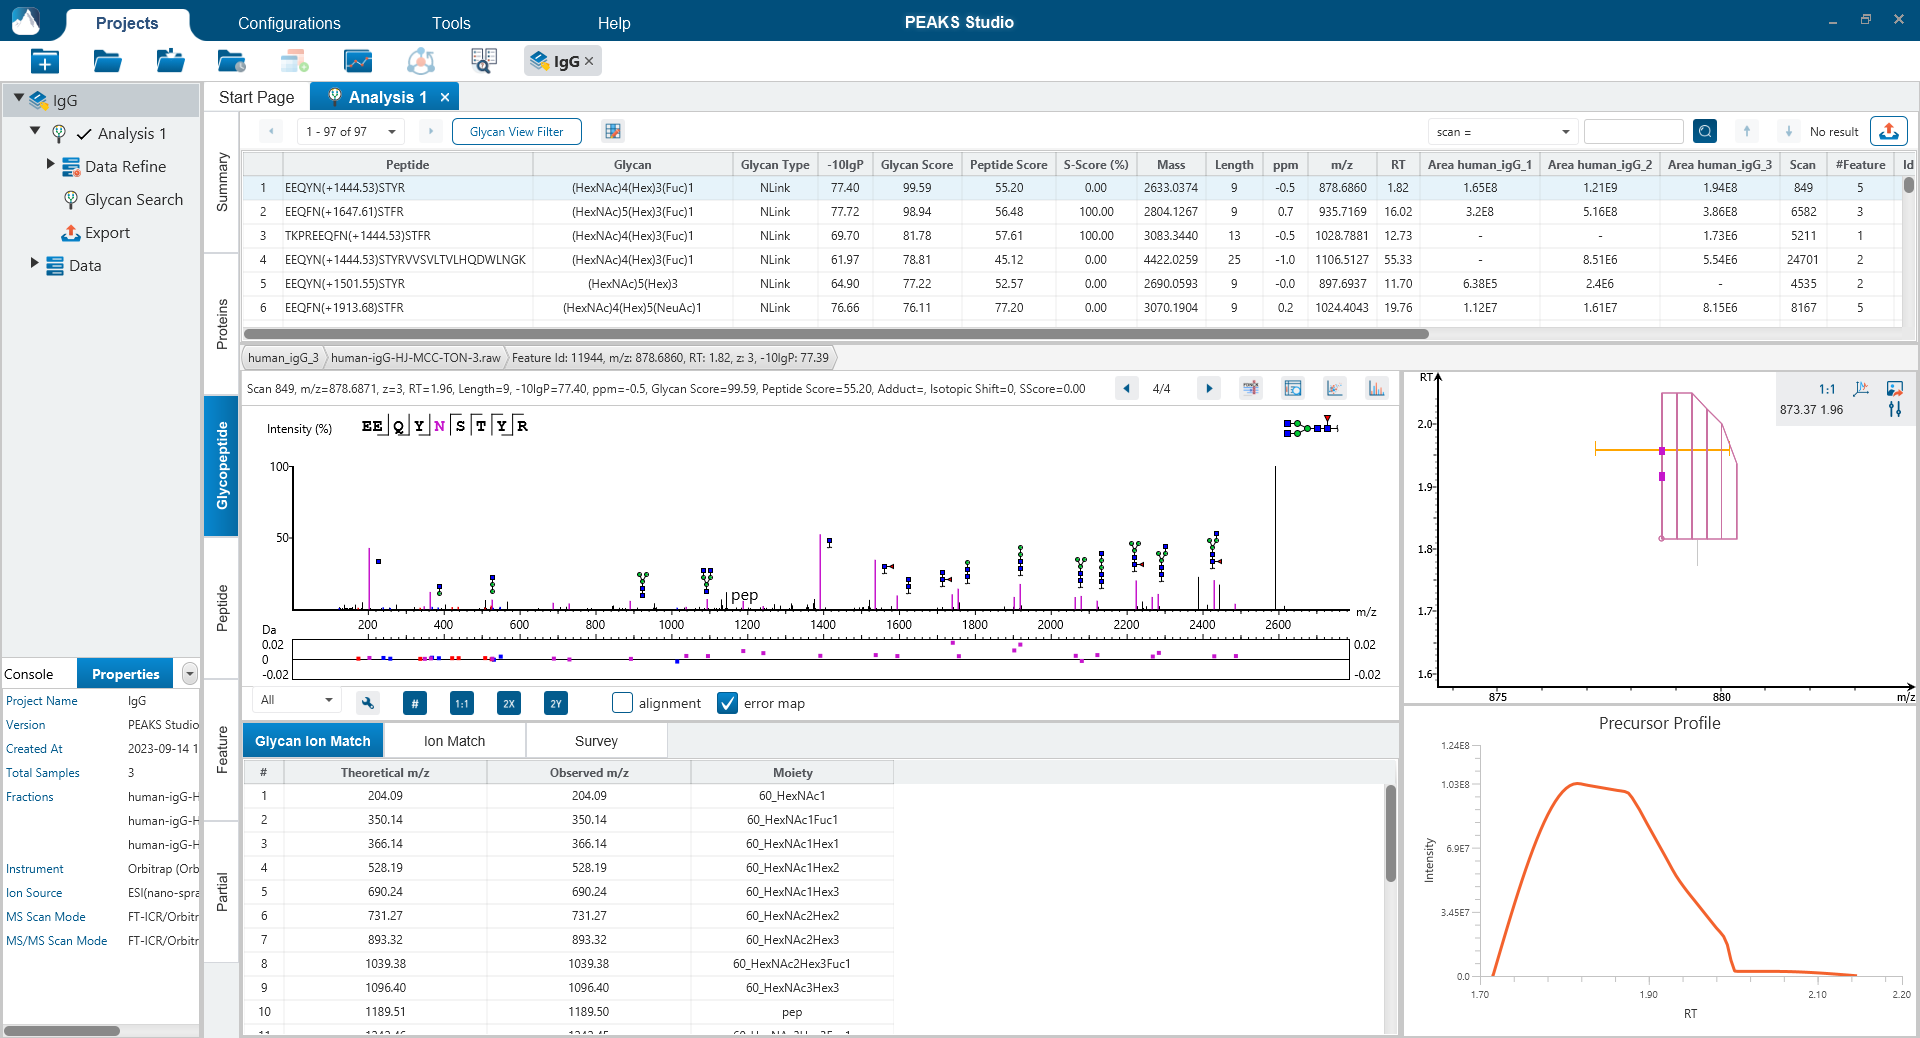
The Glycopeptide View
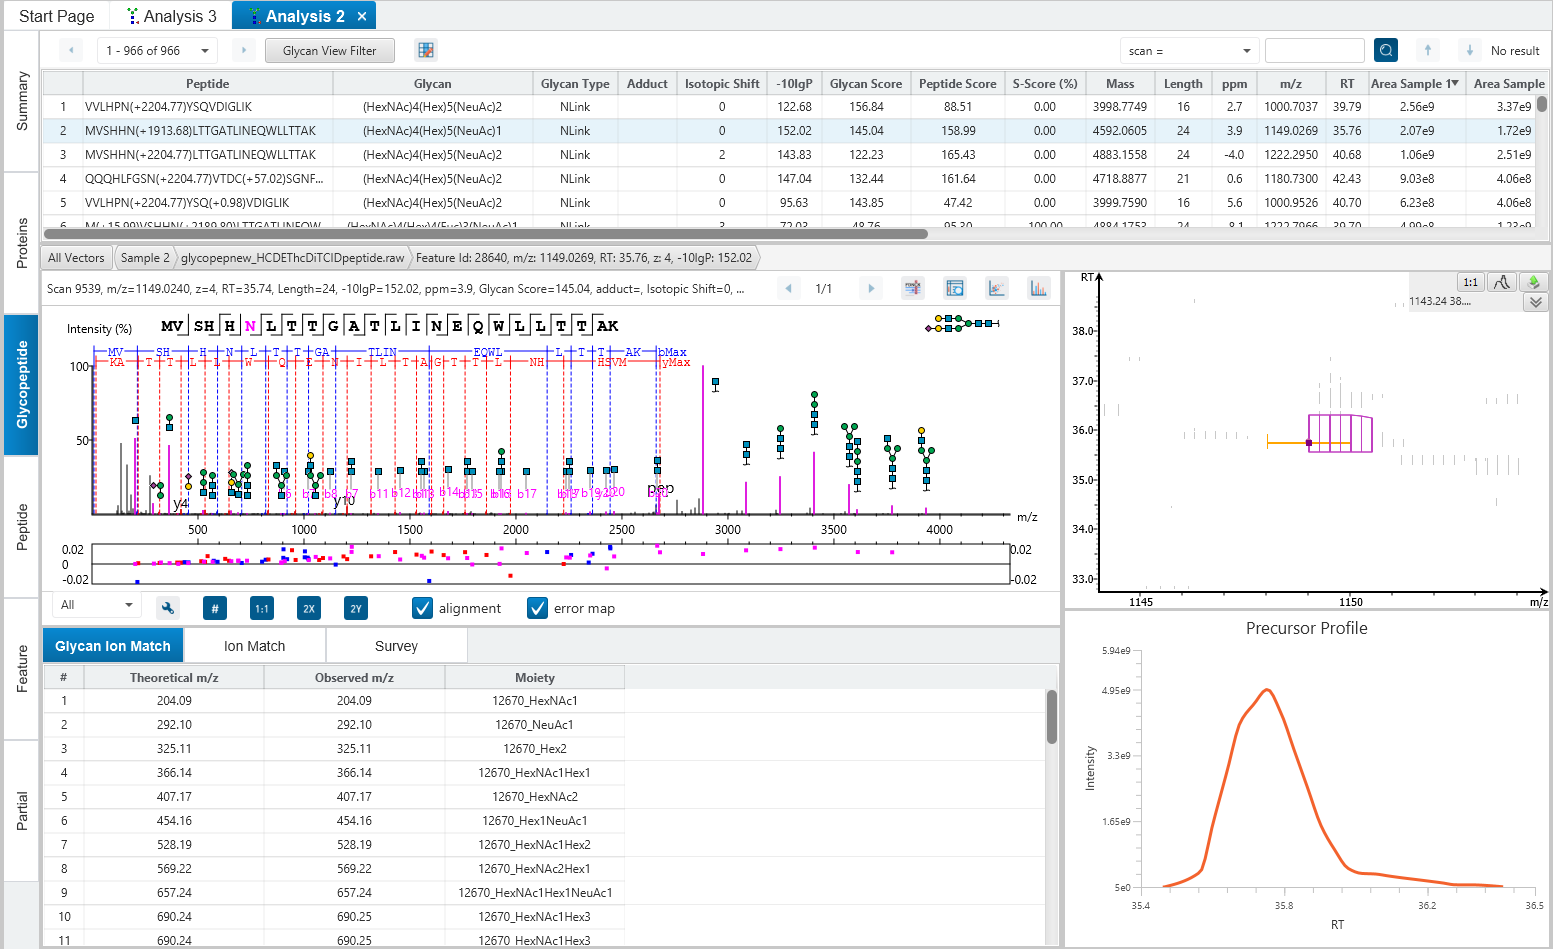
The Glycopeptide View provides a list of identified glycopeptides. For each glycopeptide, the corresponding matched glycan structure is shown. The annotated spectrum chart can toggle between viewing peptide ions and glycan ions, and spectrum annotation settings can be specified according to the users’ interest. The table is coupled with convenient view filter options and the interface provides visualisation for easy interpretation.
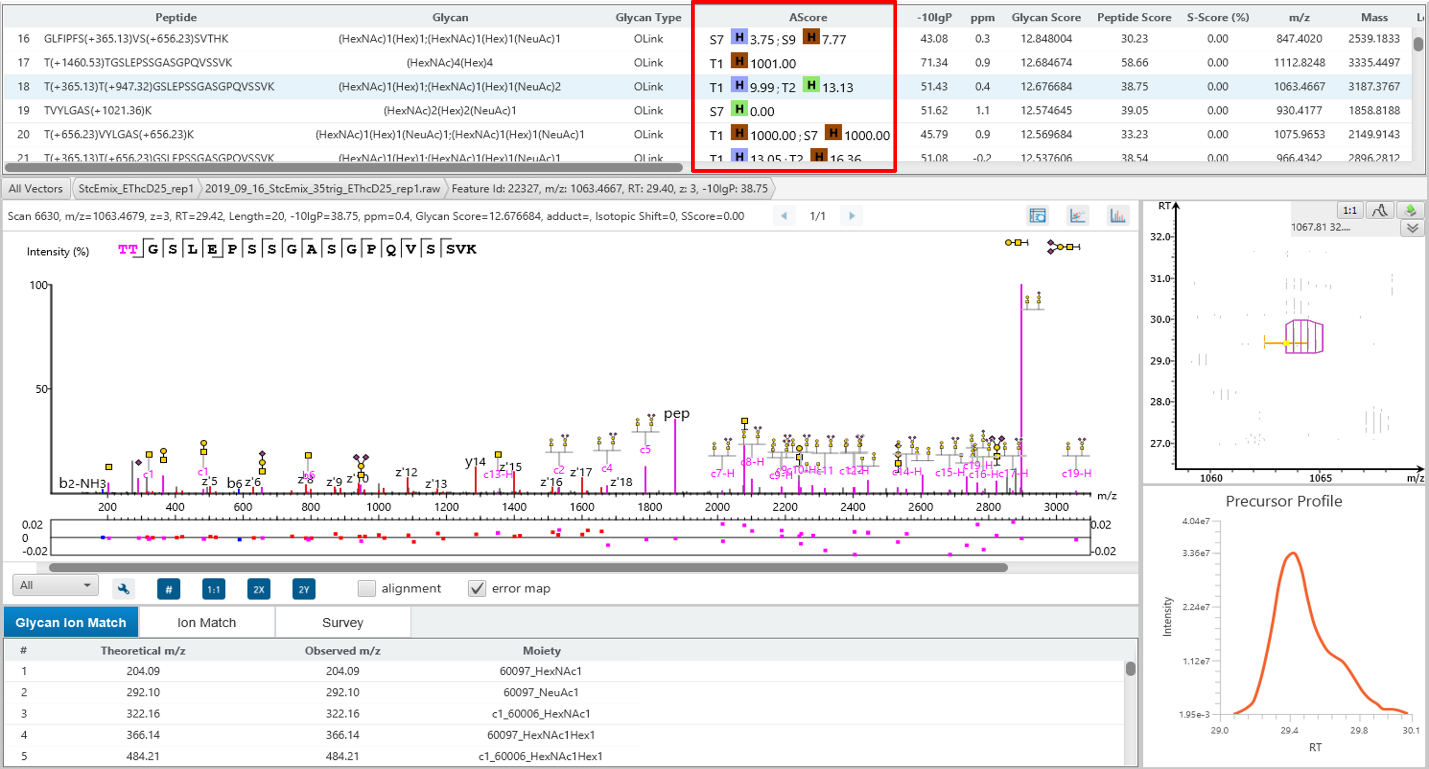
Glycosylation site specific accuracy (A-Score)
PEAKS Glycan uses an A-score, to accurately identify the glycosylation site at the MS/MS level. An A-score calculates an ambiguity score as -10 × log10 P. The p value indicates the likelihood that the glycan site is assigned by chance. Thus, a higher A-score indicates more confidence in the glycan site assignment within a peptide.
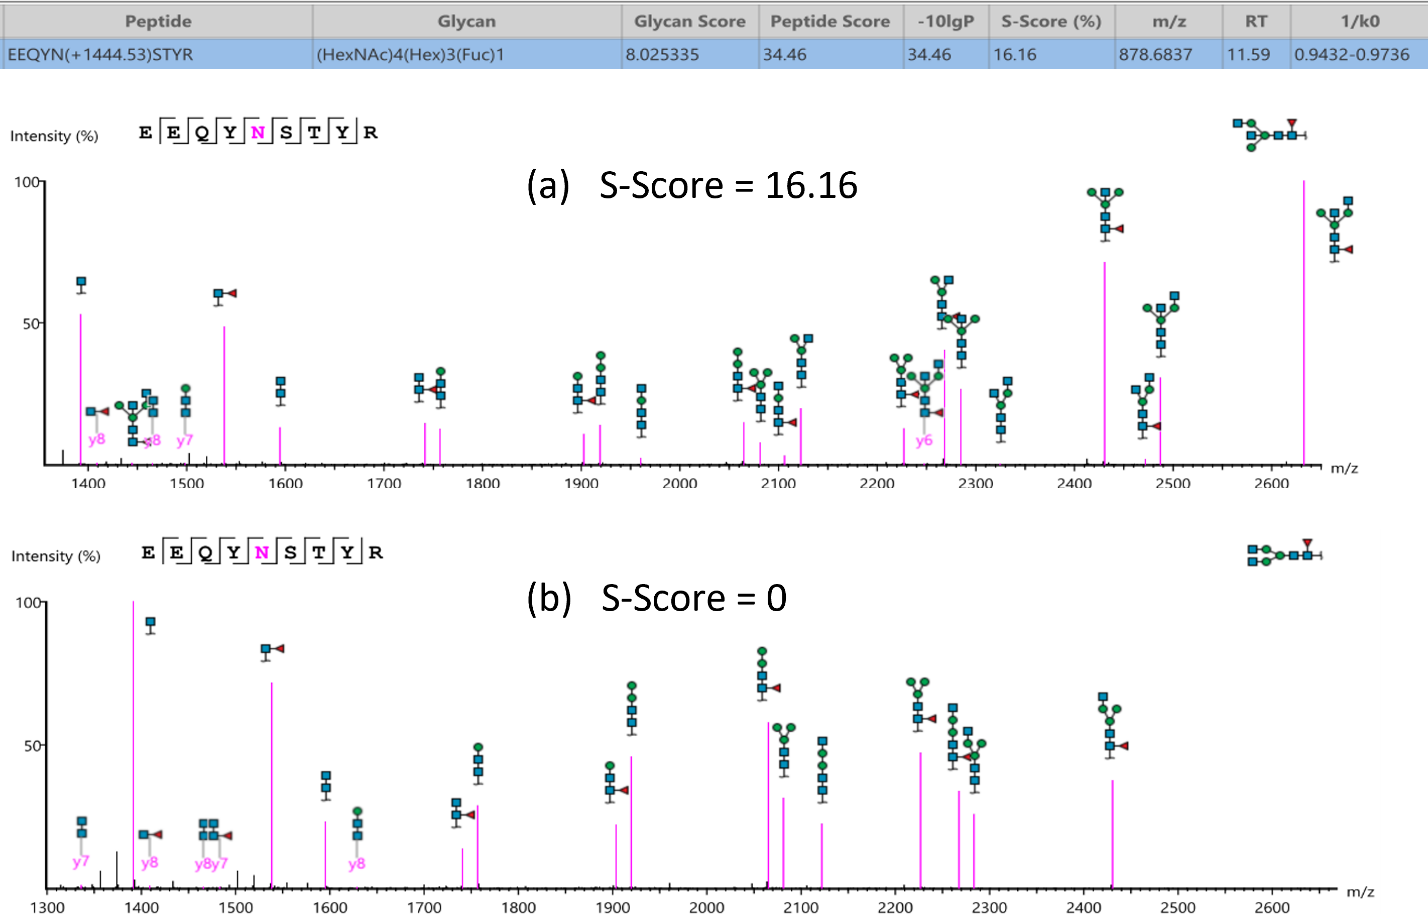
Glycan structure specificity matching (S-Score)
The associated glycan on the glycopeptide is given a S-score (%), which indicates the confidence in the matched glycan structure in the glycan database. For glycan candidates in the database with the same composition, the candidate is sorted by matched glycan Y-ion count. S-Score = (most Y-ion count – 2nd most Y-ion count)/(most Y-ion count). The higher the score the better. 100% indicates only 1 result, and it is the best match. 0% indicates that the top1 and top2 result are very similar, and we cannot confidently say the result is the best match.
Feature View
The Feature View consists of features used in identification and quantification of both peptides and glycopeptides. For multi-sample projects, this will display the list of feature vectors. Detailed graphical visualisation is provided for users to quickly analyse the results.