
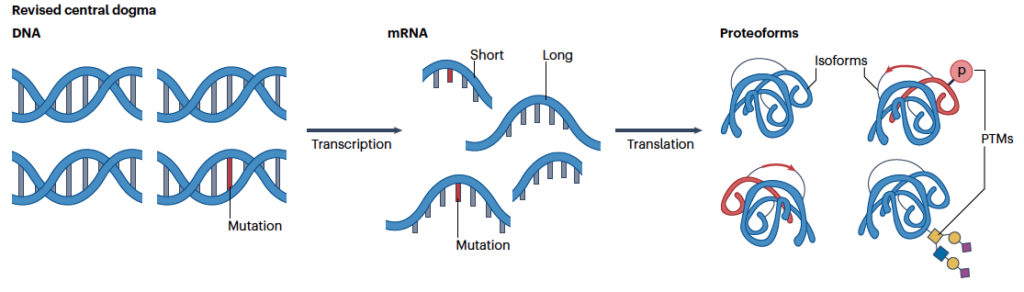
Proteins are essential for carrying out the functions necessary for life. More precisely, proteoforms which are generated from genetic variation, alternative splicing, and post-translational modifications (PTMs) define function (or dysfunction) within an organism and drive cellular functions at the molecular level.
ProteoformX™ is a powerful, user-friendly software platform designed to make intact and top-down mass spectrometry accessible and actionable. It combines rapid intact mass profiling to globally assess detectable proteoform diversity with in-depth top-down analysis to resolve full protein sequences, map modifications, and enable quantification.
Key Functions:
- Intact Mass analysis
- Top down proteome search
- Proteoform Manager
 Intact Mass Analysis
High precision mass deconvolution
Feature-based mass deconvolution identifies proteoform masses with high sensitivity and specificity, for isotopically resolved or unresolved data, across a wide range of sample types.

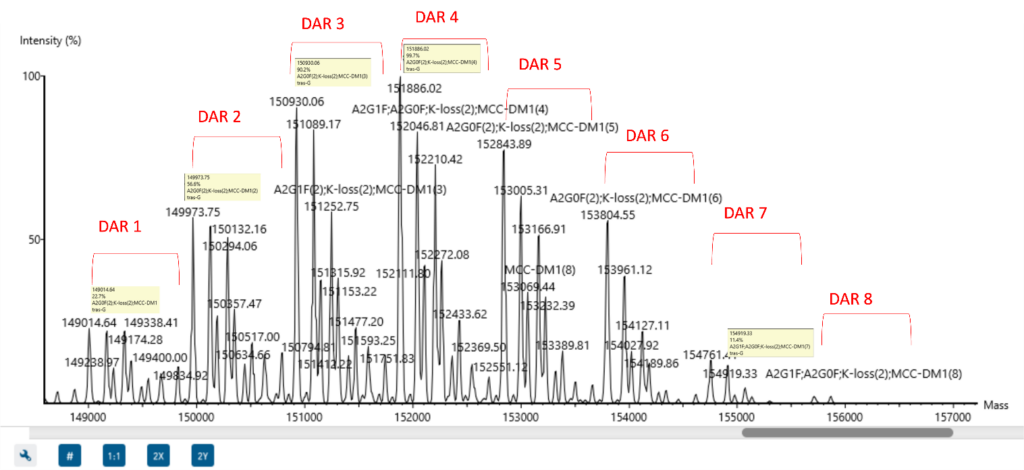
Comprehensive sample annotation with modifications and ADC drug payload
Intact mass workflow delivers accurate annotation for complex and sub-unit proteoforms, even for heterogeneous samples with modifications and ADC drug payload.
Glycosylation profile at proteoform level
Intact deconvolution accurately detects the glycosylated proteoforms of an antibody mixture.
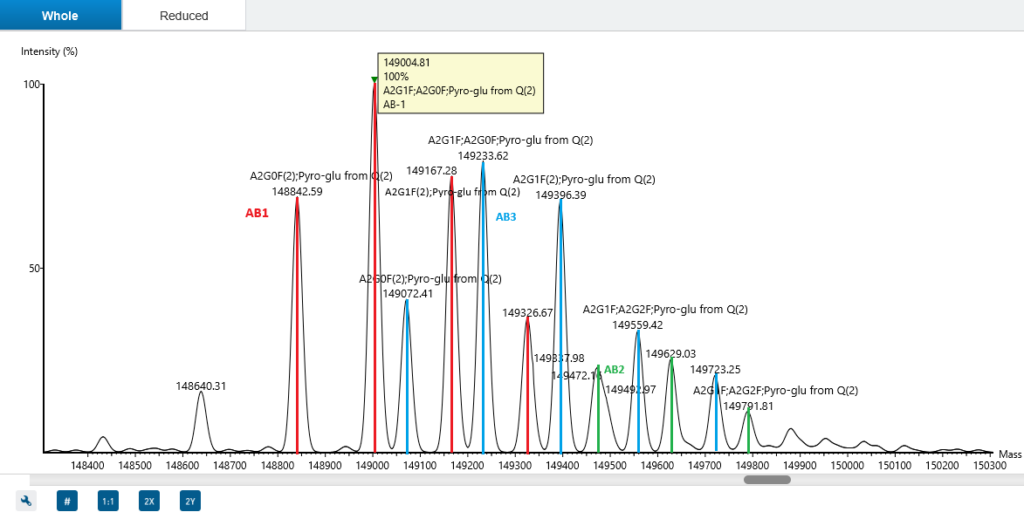
Antibody heavy chain and light chain paring
Intact annotation determines antibody heavy and light chain pairings, enabling characterisation of all antibody forms, including asymmetric antibodies and mixture.
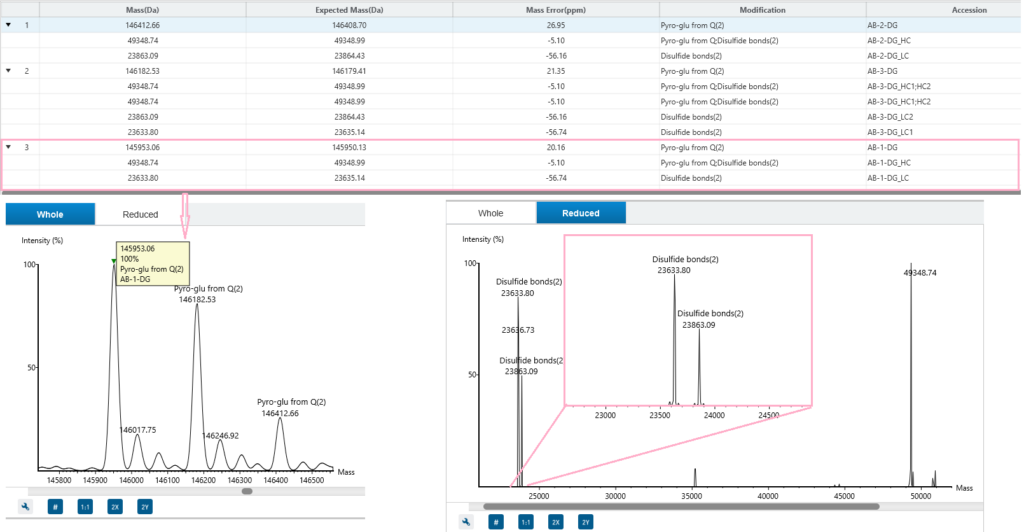
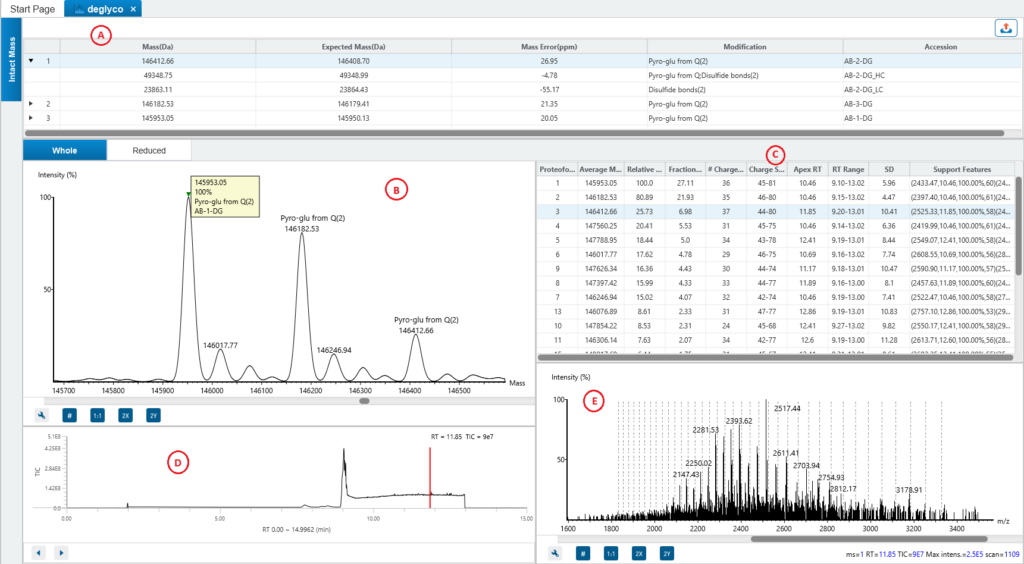
Comprehensive result view
ProteoformX™ provides a comprehensive results including interactive spectrum views with annotated peaks for transparent interpretation, along with support features in mass deconvolution tables that can be directly used to guide targeted top-down MS/MS experiment.
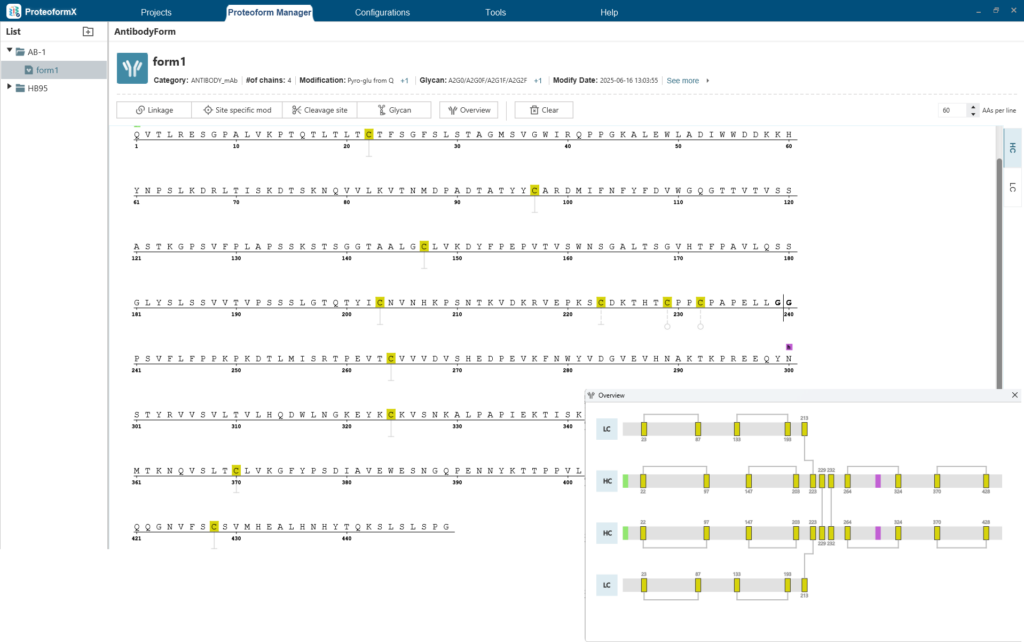
Flexible Definition and Visualization of Proteoform Variants
The Proteoform Manager in ProteoformX™ provides an intuitive interface for defining intra- and inter-chain linkages, cleavage sites, site-specific PTMs, and glycosylation events. These capabilities support comprehensive modelling of complex proteoforms relevant to biopharmaceutical analysis.
 Top-down Proteome search
Top-down MS enables in-depth characterisation of proteoforms, including precise PTM localisation. However, challenges such as data complexity and limited sequence coverage can limit throughput. In ProteoformX™ , the unparalleled user interface helps user to manual check result from raw data to identification. Diverse fragmentation methods (CID, HCD, ETD, ETHCD, UVPD) were supported.
Trace every proteoform with hierarchical insight
The intuitive hierarchical view helps user to explore results from protein to proteoform to spectrum.
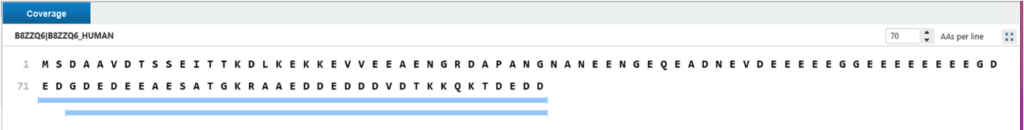
In Protein view, the coverage shows the proteoforms which are associated with protein are mapped to the protein sequence. Use the grey bar to present this region didn’t find fragment ion series but a sequence tag there. From protein view, right click to jump to proteoform table to show proteoform in detail. In proteoform coverage view, shows the proteoform information in detail, the coverage shows the cleavage which fragment ion matched, and the modification or mass shift above the sequence.
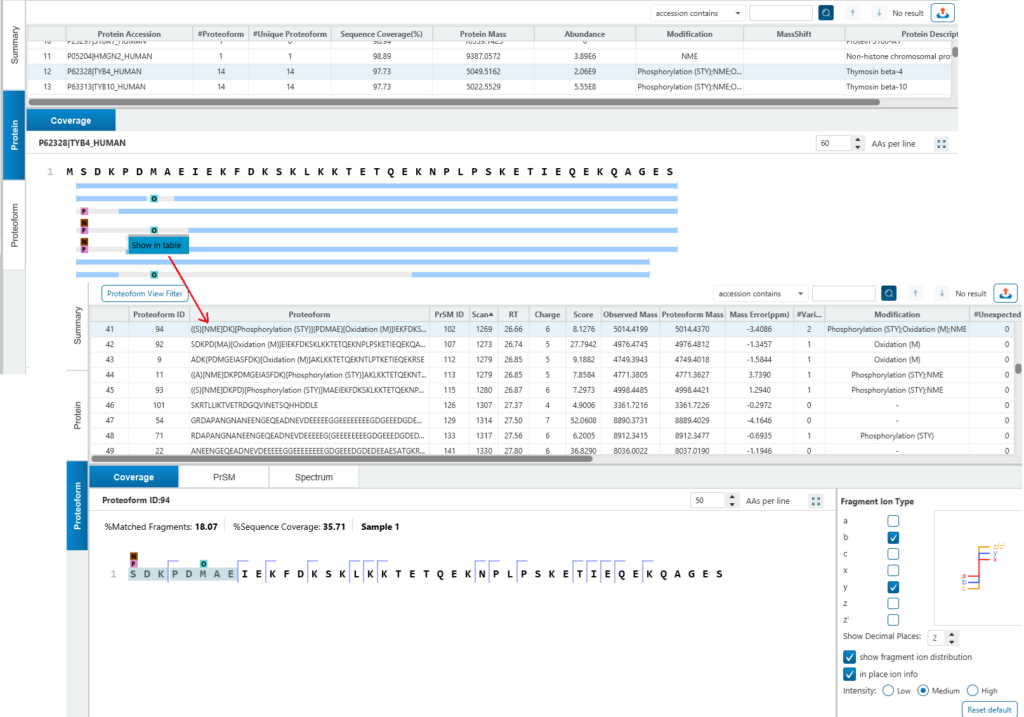
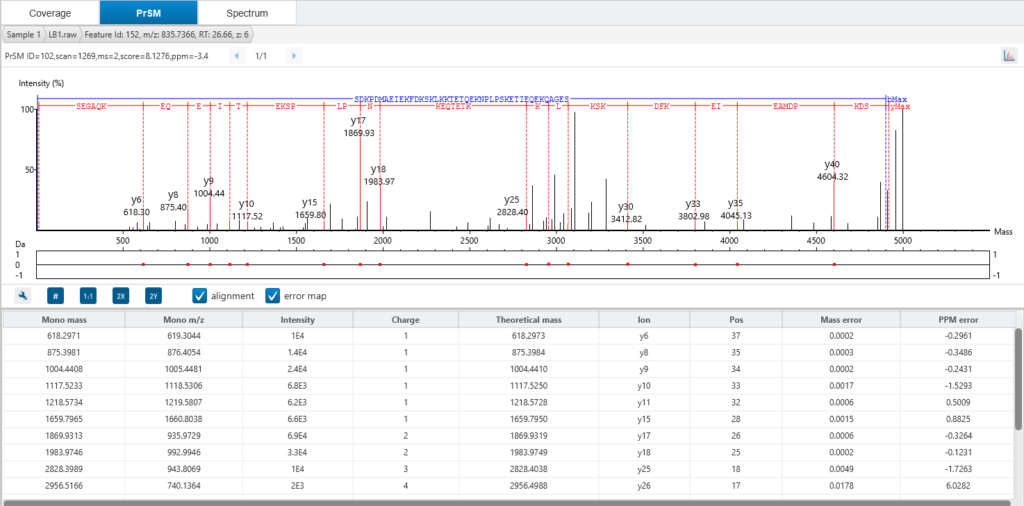
Dive deeper in the Proteoform tab, where each ID is backed by high-quality PrSMs (deconvoluted MS2 spectra), fragment ion mass table and interactive sequence fragmentation maps.
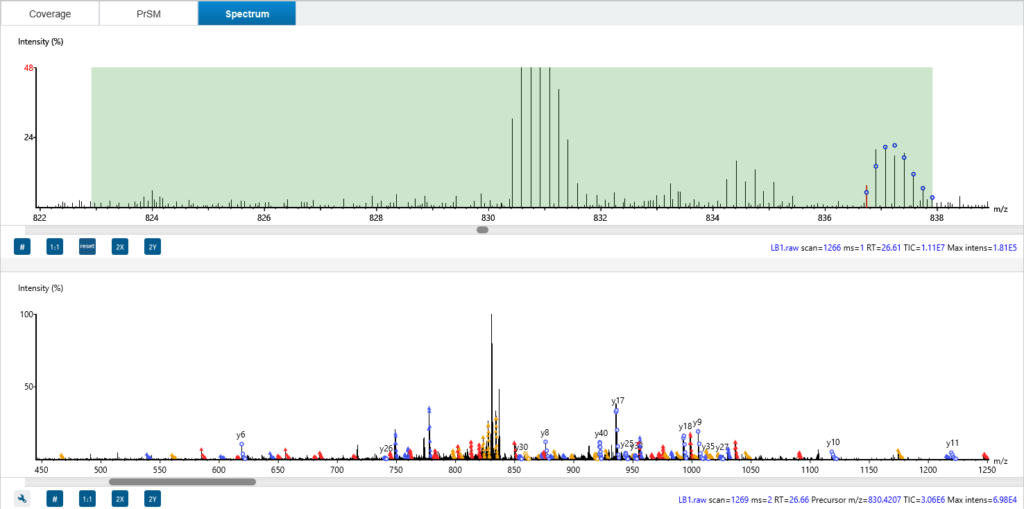
The Spectrum tab in ProteoformX™ overlays theoretical precursor peaks and fragment ions directly onto the MS1 and MS2 scans—so you can visualise isotopic envelopes, assess isolation windows, and see exactly which ions contributed to the deconvolution or even can get the chimera spectrum information. Colour-coded annotations make it easy to distinguish ion types and unmatched fragments, giving you unmatched transparency and confidence in your results.
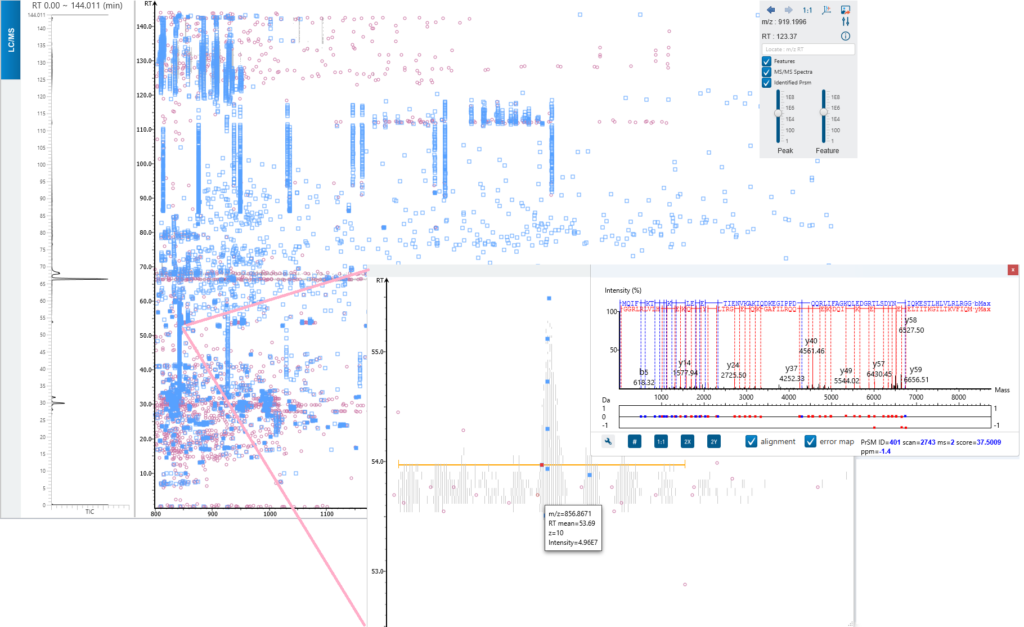
Feature based insight of the TD data (LC-MS view)
As a feature-based algorithm for intact and top-down analysis, ProteoformX™ provides LC-MS view with ms/ms spectrum and its associated features. Zoom in to check each feature in detail.
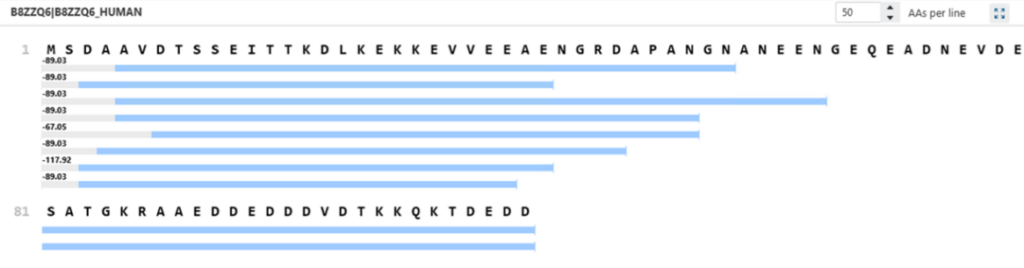
In-depth top-down proteome identification with open search
Enabling OpenPTM Search increases proteoform identification by allowing for unexpected modifications and truncated forms. In the example below, only two C-terminal proteoforms of the B8ZZQ6 protein were identified without OpenPTM Search, while eight were detected when it was enabled. One of these additional proteoforms featured a –89.03 Da mass shift, consistent with methionine loss and N-terminal acetylation—an established but often overlooked modification. By broadening the search space to include mass shifts and non-canonical termini, OpenPTM Search enables more comprehensive and accurate proteoform profiling.
References
- Roberts, D.S., Loo, J.A., Tsybin, Y.O. et al. Top-down proteomics. Nat Rev Methods Primers 4, 38 (2024). https://doi.org/10.1038/s43586-024-00318-2