Label-Free Quantification
With rapid enhancement in instrumentation, label-free quantification (LFQ) methods serve as a useful alternative for quantitative proteomics, especially when isotopic or chemical labels are not feasible or prohibitively expensive.
With the addition of PEAKS Q quantification add-on module, users can perform label-free quantification as part of their data analysis workflow. The method is based on the relative abundance of all peptide features detected in at least two samples. Peptide feature detection is performed independently on each sample, allowing for the detection of overlapping features. Subsequently features of the same peptide across multiple samples are reliably aligned together using a high-performance retention time alignment algorithm (and ion mobility alignment for IMS-MS data).
Interpreting Results
The PEAKS Q module generates a user-friendly interactive results page, which includes a summary of the data as well as more specific and detailed information for every peptide feature. Furthermore, an easy-to-use parameter filter allows the user to filter the label free quantification data by a number of parameters including minimum fold change, number of unique peptides and even specific charge states.
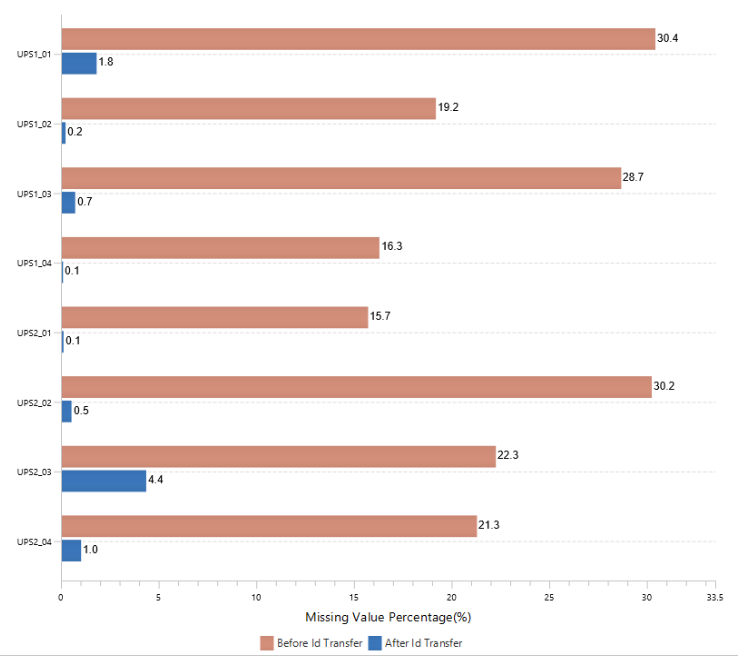
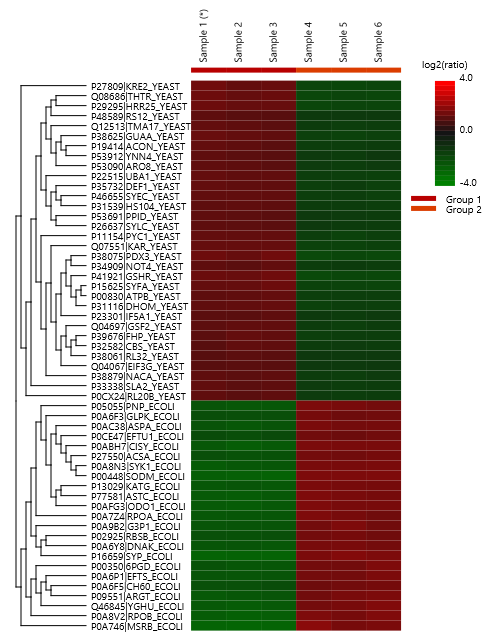
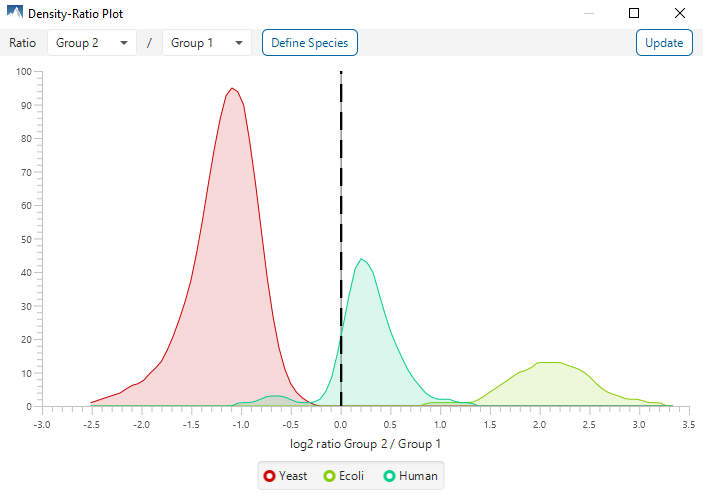
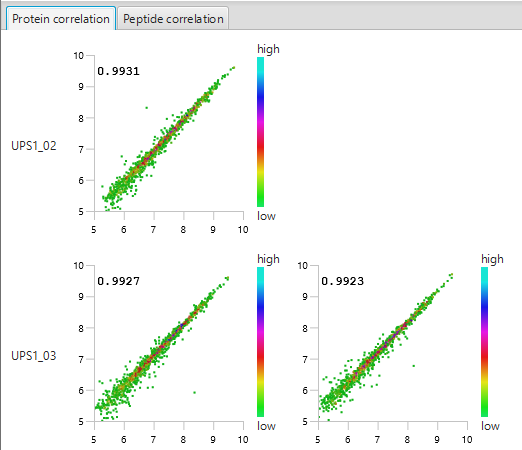
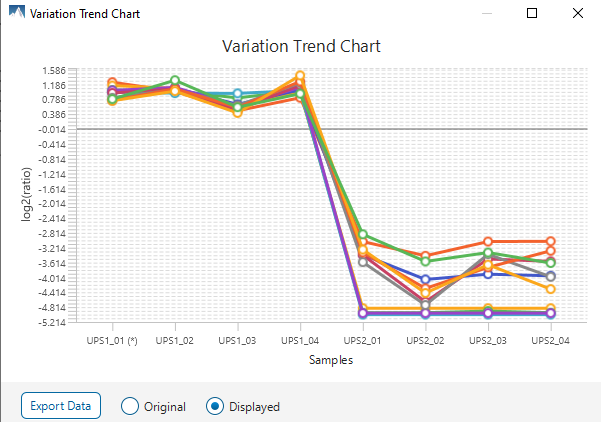
The summary report that is included with every PEAKS Q LFQ search includes overall statistics of the quality and abundance of the samples as well as an interactive heat map (Figure 1), variation trends, a density-ratio (Figure 2), and protein, peptide and feature correlation plots (Figure 3). Finally, a graphical overview showing the percentage of missing values before and after ID transfer (match between runs) is shown (Figure 4). This chart can quickly alert the user of any outlier samples in identifications.
The PEAKS LFQ default result view was designed to easily determine which proteins were significantly changed in one group to the next. As a result, not all proteins are shown by default. However, it is very easy to see all the quantifiable proteins simply by changing the filters provided in the result view.
Missing Values and ID-Transfer
Label-free quantification is commonly used to perform proteome-wide quantification in large biological cohorts. To reliably interpret the data, ID-transfer between runs is vital to reduce false missing values. False missing values are generated by the stochasticity of data-dependent acquisition (DDA) or the difficulty in interpreting MS2 spectra, typically containing multiple co-fragmented precursors in direct database search, and limited quantitative depth using spectral library-based peptide identification in data-independent acquisition (DIA). With ID transfer, the missing values could be significantly reduced.
With PEAKS Q, the label free workflow uses an MS2-based identification and an MS1-based quantification approach. As of PEAKS X+, a graphical figure is presented to allow users to easily assess the percentage of missing values before an after PEAKS’ ID-transfer algorithm.