PEAKS PTM Analysis
- Identification of PTMs with PEAKS database searching
- Discovery of unspecified or hidden modifications with PEAKS PTM to maximise PTM identifications
- Quantitative analysis of PTMs by PEAKS PTM Profiling
Protein post-translational modifications (PTMs), such as phosphorylation, ubiquitination, acetylation and methylation, play critical roles in diverse biological processes such as signalling and regulatory processes, protein activity and degradation, regulation of gene expression, etc. Identification and characterisation of PTMs are essential for a comprehensive understanding of cellular biology and human diseases and have a wide range of applications. Since PTM information is usually absent or incomplete in protein databases, identification of PTMs via mass spectrometry poses a number of challenges to the traditional database search approach.

Contact us to add PEAKS 11 to your lab!
The advanced algorithm included in PEAKS maximises PTM identification and PTM Profiling. PTM identification of PTMs is achieved by integrating PEAKS database searching and de novo sequencing results.
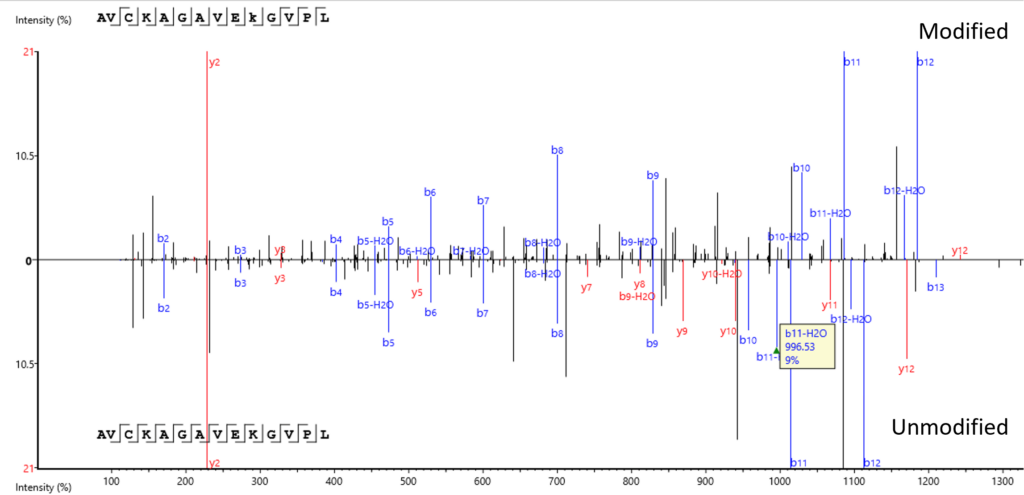
Modified Peptide tab provides a comparative view of the modified and unmodified peptides side by side and in a mirror spectral view. The PTM Profile tool further assists your PTM studies by providing qualitative and quantitative information and direct visualisation and easy export of results.
PTM Identification
PTM identification can be performed in PEAKS database searching and PEAKS PTM searching.
By Database Searching
In database searching, only a limited number of frequent known PTMs can be specified as variable modifications.
In protein result view, supporting peptides represented by blue bars are mapped to the sequence of the selected protein. By clicking the peptide, its MS2 spectrum will show up, where you can easily examine the annotated MS data.
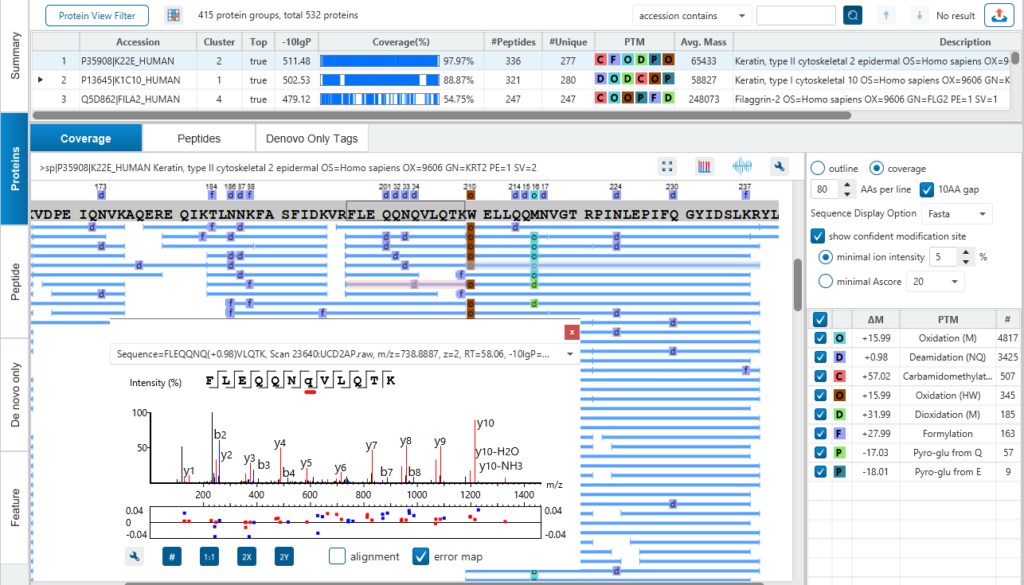
Amino acids that have PTMs are in lower-case in the peptide sequence in its MS2 spectrum.
By PEAKS PTM Searching
Specifically designed to discover hidden modifications by integrating the powerful de novo sequencing algorithm and database searching.
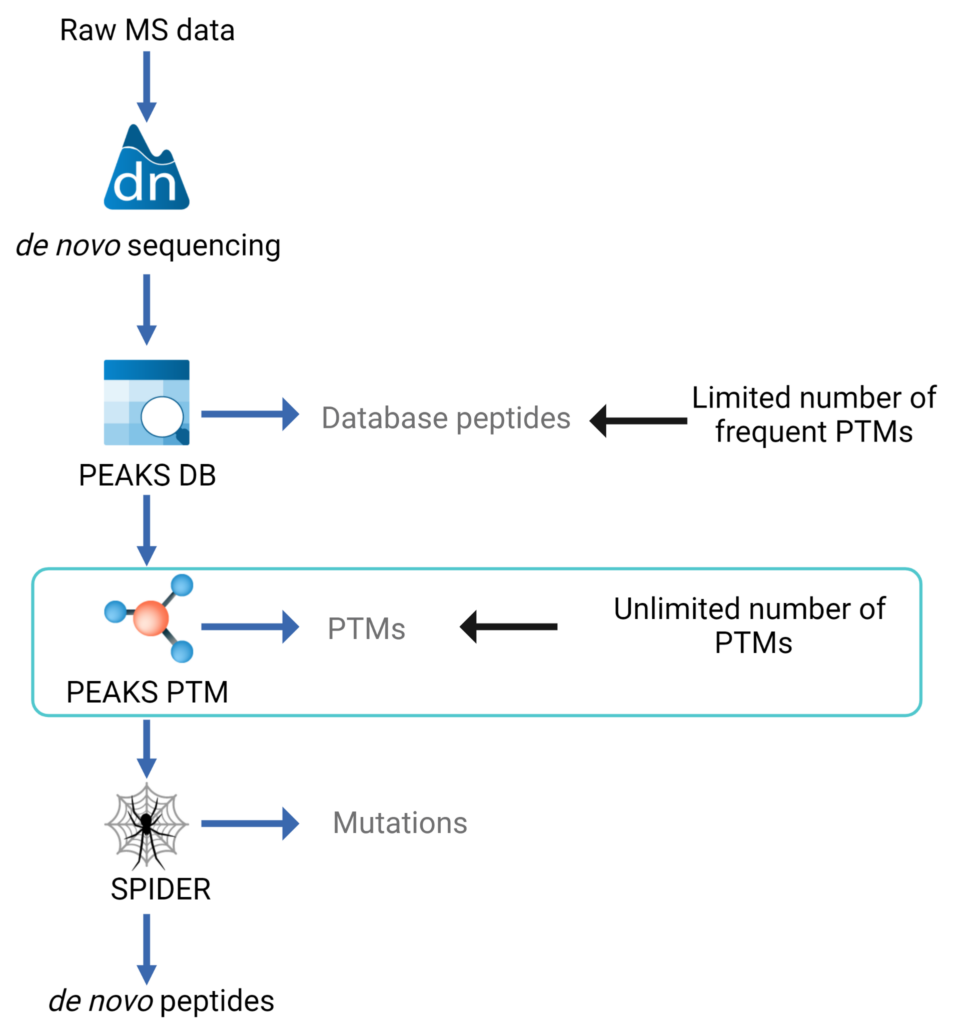
This multiple-round search approach is illustrated in the data analysis workflow figure:
- de novo sequencing is carried out for each spectrum
- PEAKS database (DB) algorithm is used to identify proteins. A few highly frequent PTMs can be specified in this round to maximise sensitivity
- PEAKS PTM algorithm[1] is used to identify more PTMs. In this round, only the spectra with high confident de novo scores but are not assigned by database searching are mapped against the identified proteins. Users can specify as many PTMs as they want or they can simply turn on all of the over 650 PTMs and mutations in the Unimod database.
- Additional Confident PTM algorithm and the use of Potential Signature Ions are implemented for modified peptide re-scoring and therefore achieving an enhanced accuracy in PTM identification.
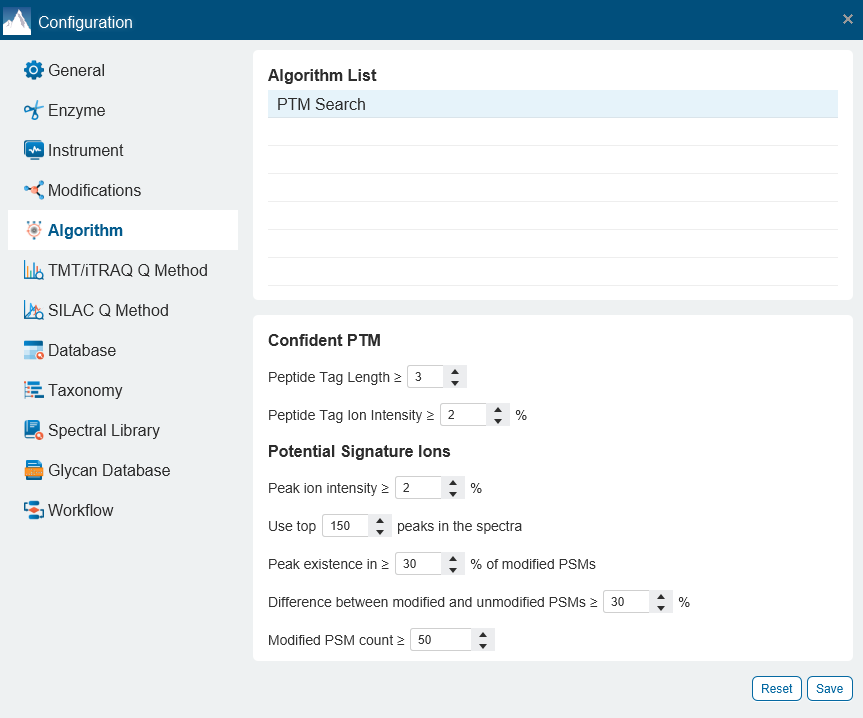
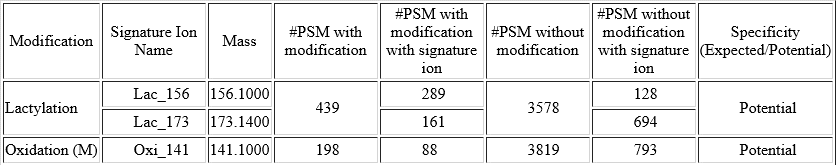
For each modification of interest, PEAKS PTM records the number of Modified PSMs with the detected signature ions as well as the number of Unmodified PSMs, where the analogue signature ions were detected. The difference between the % of the Modified PSMs with the potential signature ion detected and the % of Unmodified PSMs with the potential signature ion detected indicates if this signature ion is a potential signature ion used for peptide re-scoring.
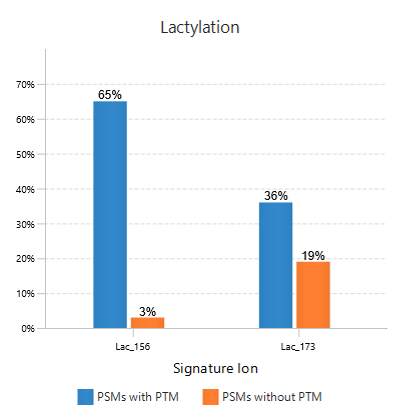
In this example of Lactylation (K) with two potential signature ions[2]: linear immonium ion (m/z = 173.1400) and cyclic immonium ion (m/z = 156.1000).
The figure to the right shows Frequency Plot of Detected Signature Ions for Lactylation (K).
PTM Site Determination
The exact site of modification can be determined by the presence of site-determining fragment ions. In the example shown, the presence of b11 and b-12 ions in the MS2 spectrum determines the deamination occurs on asparagine at position 12.
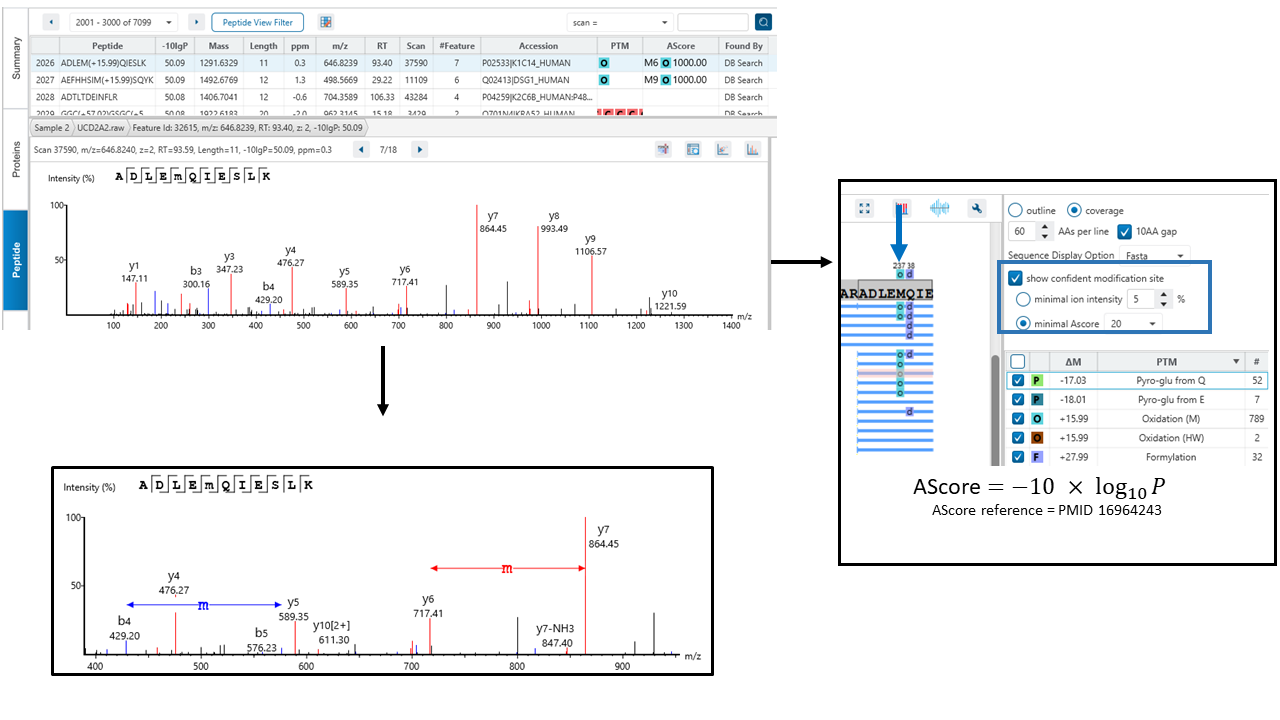
PEAKS provides two options for users to determine confident modification sites:
- Minimal ion intensity, which requires that the relative intensities of the position-determining fragment ions in a MS/MS spectrum must be higher than the number users input.
- Ascore, which calculates an ambiguity score as -10 × log10 P. The p value indicates the likelihood that the peptide is matched by chance. Therefore the higher Ascore the better.
Both methods provide measures of the confidence that can be placed onto the PTM site localisation. If the threshold of the method users select is met, the PTM will be in a coloured box above the residue in protein coverage view result.
PTM Profiling of Modified and Unmodified Peptides
PTM Profile tool provides a direct visualisation and summary of the quantitative PTM site information (e.g. abundance of modified and unmodified forms containing the PTM sites identified).
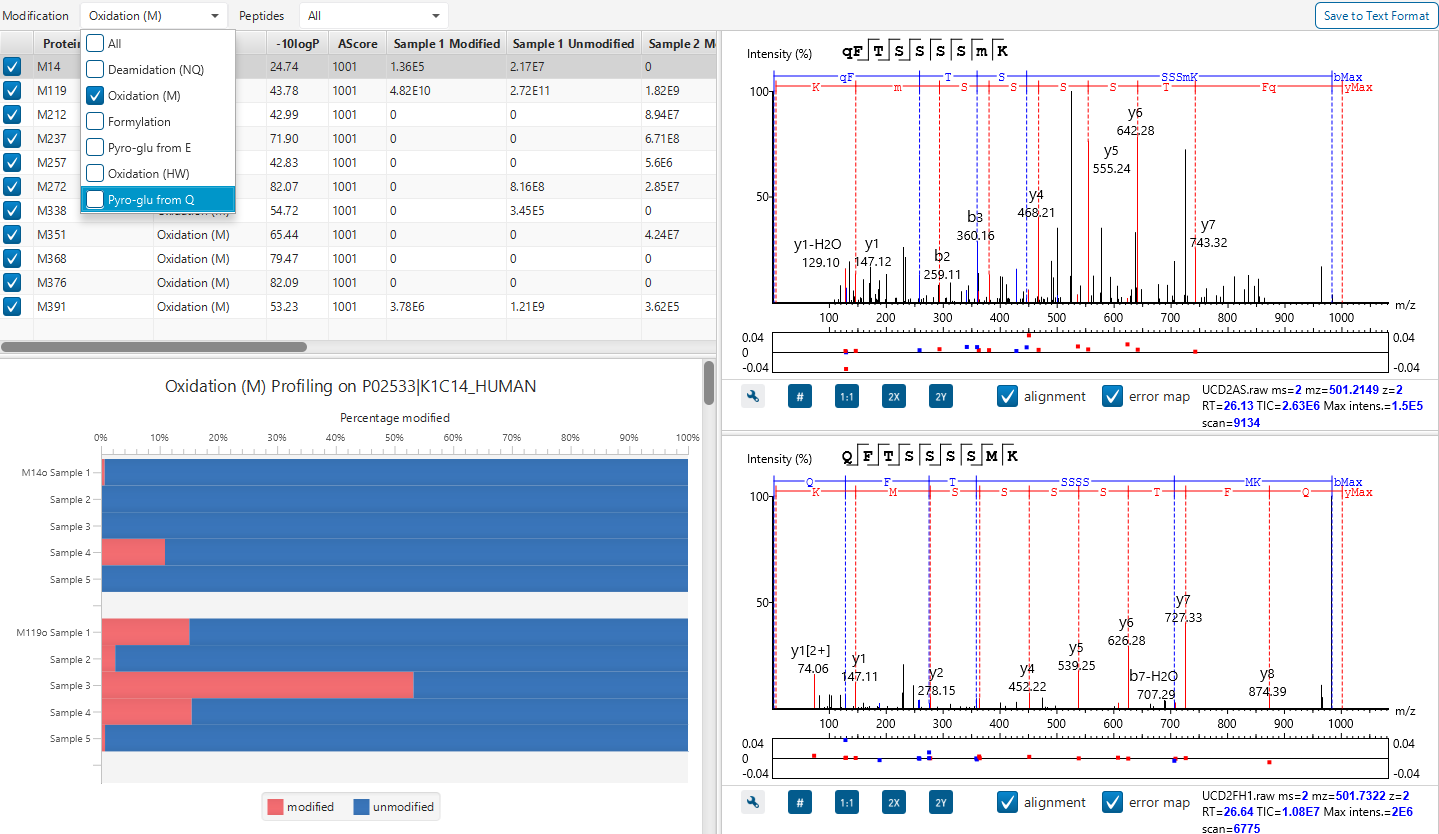
In addition, PTM Profile calculates the difference in abundance between peptides with confidently identified PTMs versus unmodified peptides across all samples analysed. Peptide feature areas are used for this comparison.
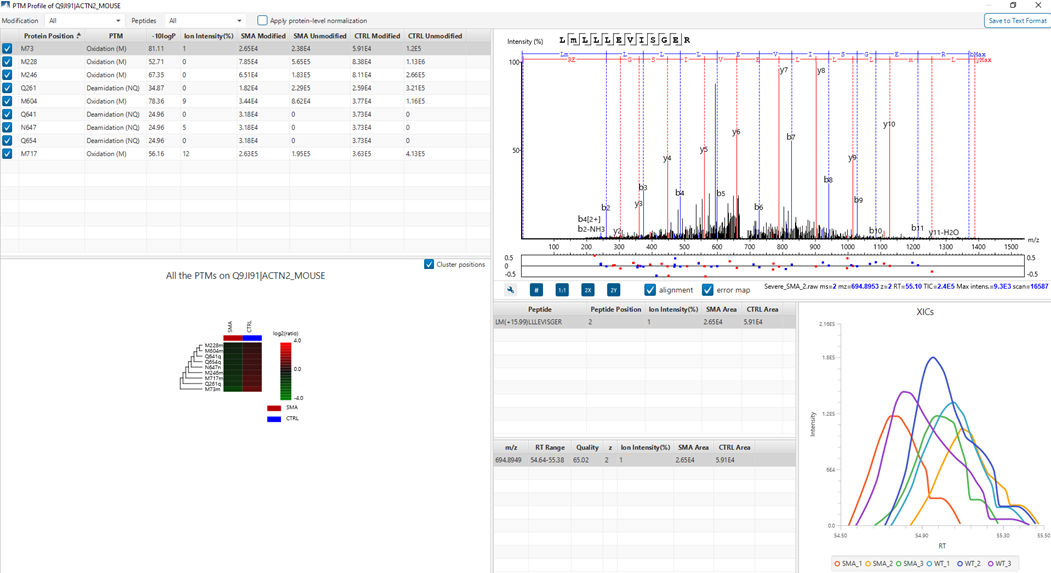
PTM Profile results can be exported to images and csv files containing detailed quantification information for the modified sites.
References & Resources
References
- Han X, Xin L. Shan B. Ma B. PeaksPTM: Mass spectrometry-based identification of peptides with unspecified modifications. J. Proteome Res., 10, 2930-2936 (2011). https://pubs.acs.org/doi/10.1021/pr200153k
- Wan N, Wang N, Yu S, et al. Cyclic immonium ion of lactyllysine reveals widespread lactylation in the human proteome. Nat Methods. 2022;19(7):854-864. doi:10.1038/s41592-022-01523-1