
Protein Identification Software
- LC-MS/MS search engine
- Modification search and PTM profiling
- Sequence Variant Search
- Integrated with de novo sequencing
- Supports all types of fragment ions:
CID, HCD, ETD/ECD, and EThcD
Protein Identification with MS/MS
Bottom-up proteomics (LC-MS/MS) serves as the basis for much of the protein research today. There are a variety of algorithms for the interpretation of peptide fragmentation data. The commonly employed algorithms attempt to determine the identity of a peptide by comparing the observed fragmentation pattern to theoretical fragmentation patterns derived from protein sequence databases. PEAKS DB protein identification integrates database search with de novo sequencing for peptide identification. Thus, it provides complete peptide identity, including peptides with a variety of modifications, sequence variants, and novel peptides.
Accuracy & Sensitivity
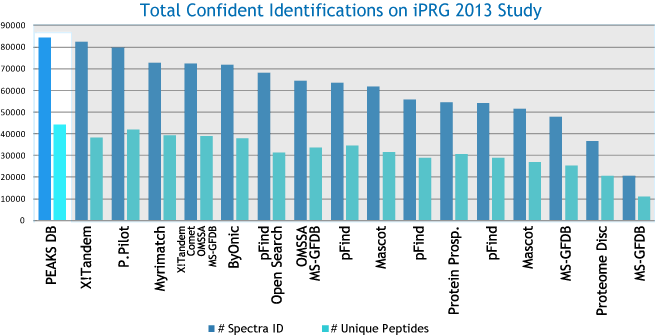
PEAKS DB uses a tag-based search algorithm, which enables search accuracy and sensitivity. The unique target-decoy database approach, called “decoy-fusion”, provides PEAKS DB with a very accurate false discovery rate (FDR). It proves to be a more accurate and sensitive database search engine for protein identification.
Peptide Identification performance of database search engines
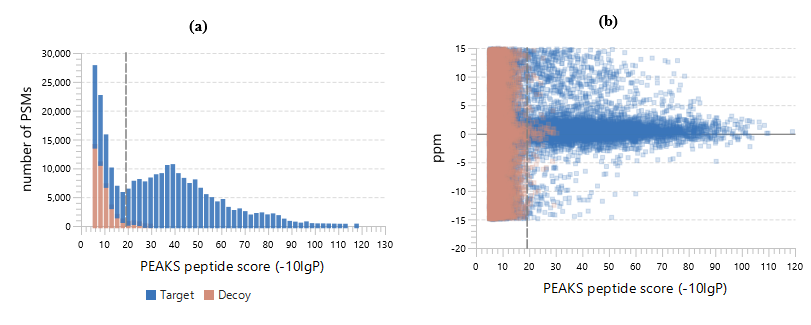
PEAKS DB automatically performs a statistical analysis to summarize the protein identification database search task and shows the statistics in a Summary View. Users can easily filter the database search results through specifying a desired FDR.
Result Validation
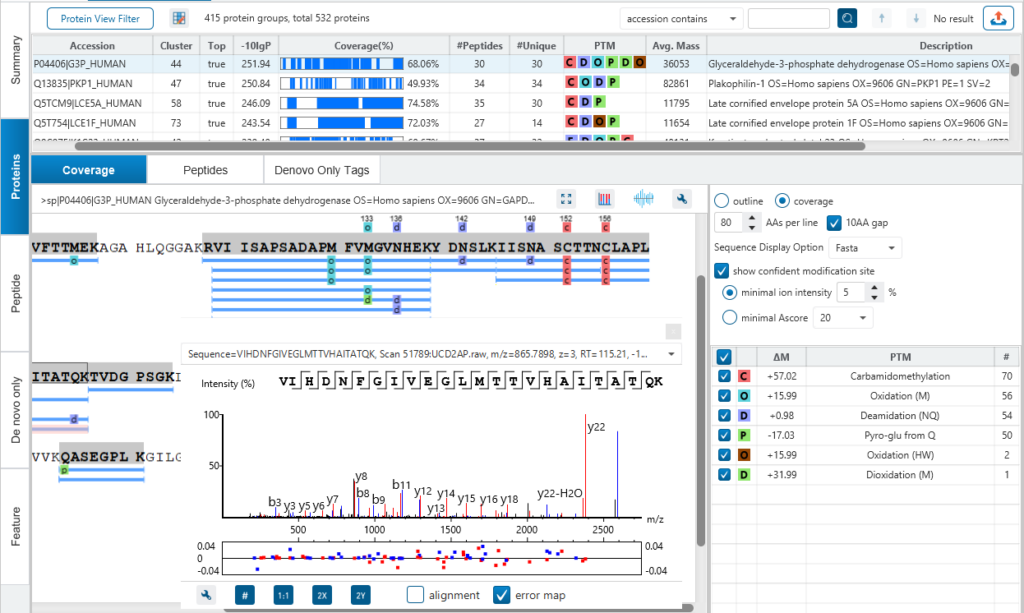
PEAKS is well-known for its superior result visualization. Besides the above described Summary View, users can examine the protein identification results in a number of convenient ways from different angles.
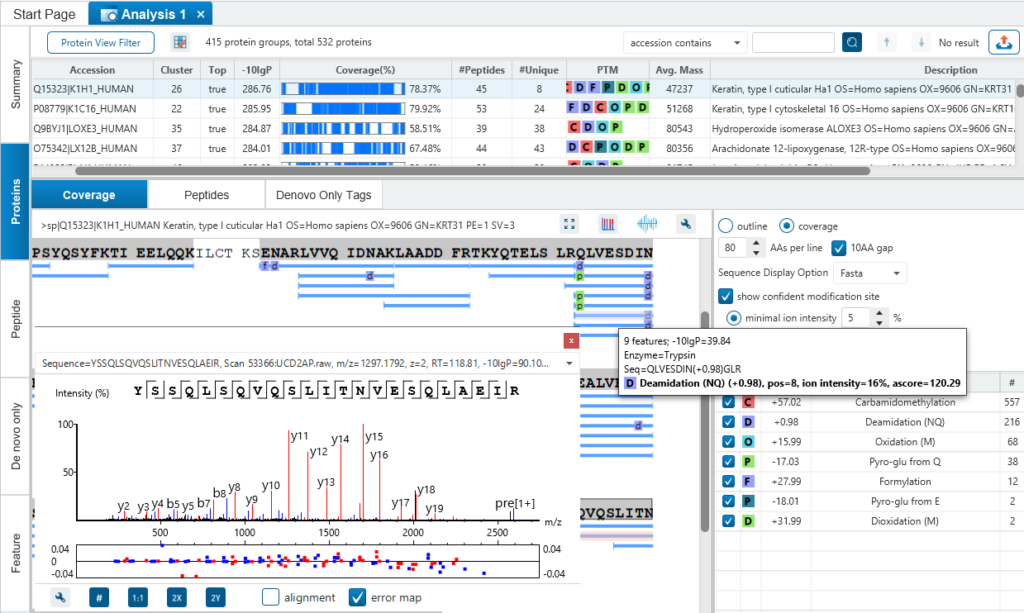
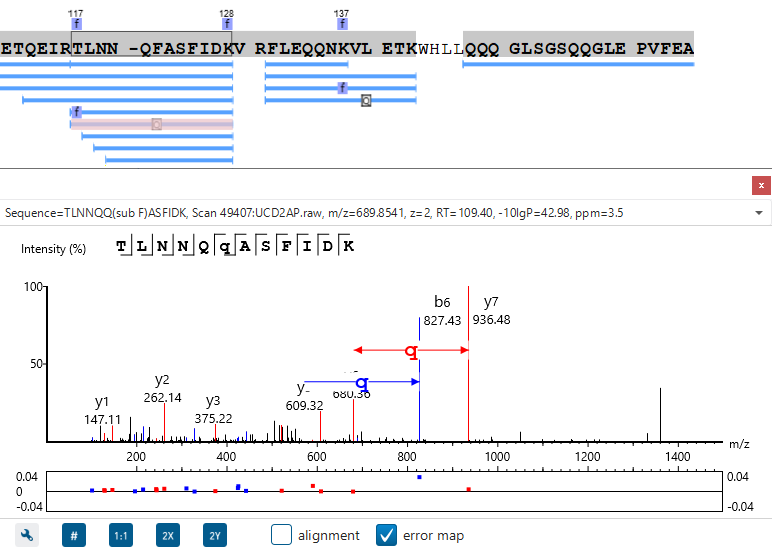
In particular, the Protein Coverage View provides a good starting point to examine all identified peptides of a protein, with the PTMs and mutations highlighted.
Clicking a peptide can bring up the peptide-spectrum matching annotation and moving the mouse over an amino acid in the annotated peptide sequence can show the corresponding supporting peaks.
Integrated with de novo Sequencing
The assumption in traditional search engines is that all proteins of interest are presumably contained in the database. But this assumption often does not hold true as many important proteins, such as monoclonal antibodies, are not contained in any database. So, an inherent drawback of such search strategies is that they are only as good as the database(s) being searched and incomplete databases often result in peptides being misidentified or left unidentified.
With PEAKS DB, users can now complete identification of peptides whether in the database or not.
Identification of homolog peptides
References & Resources
References
- Tran NH, Qiao R, Xin L, Chen X, Liu C, Zhang X, Shan B, Ghodsi A, Li M, Deep learning enables de novo peptide sequencing from data-independent-acquisition mass spectrometry, Nat. Methods, 16, 63–66 (2019). https://doi.org/10.1038/s41592-018-0260-3
- Zhang J, Xin L, Shan B, Chen W, Xie M, Yuen D, Zhang W, Zhang Z, Lajoie G.A., Ma B, PEAKS DB: De Novo Sequencing Assisted Database Search for Sensitive and Accurate Peptide Identification. Mol. Cell. Proteomics. 11, M111.010587 (2012). https://doi.org/10.1074/mcp.M111.010587