Protein Quantification
Basics
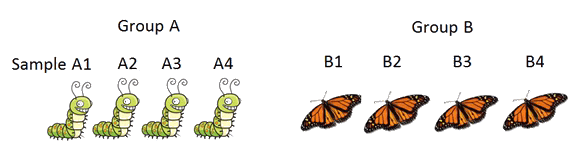
Protein quantification compares two (or more) groups of biological samples to find out the proteins that change concentration across the sample groups. In doing so, hopefully the proteins that are correlated to the condition change (e.g. disease vs. control) of the two sample groups can be revealed. After further validation, such proteins have the potential to become important biomarkers to assist disease diagnoses, drug design, and treatment selection. Today protein quantification is mostly carried out with mass spectrometry.
and tries to find the proteins that change quantities across groups.
Validation vs. Discovery
In searching for biomarkers, researchers usually do not want to exclude any proteins from the consideration. Instead, the whole proteome is used in the experiment and it’s up to the bioinformatics software to report a list of proteins that have high potential. This can be regarded as the “discovery phase” of protein quantification, where the primary goal of the experiment is to find out which proteins’ quantity changes are correlated to the change of sample groups; and whether the correlation is statistically significant. The precise quantity ratio of each protein is also a secondary goal of the experiment.
In another scenario, researchers may already know a list of proteins of interest. (For example, the list might have been identified with a “discovery phase” experiment.) Then, the goal of additional experiments is to validate such knowledge, and to accurately measure the fold change of each protein. This type of experiment can be regarded as the “validation phase” of protein quantification. This goal is usually achieved with the SRM (selected reaction monitoring) method. This page concerns the “discovery phase”.
Types of Protein Quantification
Isotope Labelling vs. Label-Free
In the “discovery phase” of quantification, the goal is to find out the proteins (from the whole proteome) whose quantity changes are significantly correlated to the change of sample groups. The experiments for such a purpose can be broadly divided into two categories: isotope labelling and label-free.
In the isotope labelling experiments, proteins from different samples are labelled with isotope-labels. Then the samples are mixed together for the LC-MS/MS experiment. The same peptide from two (or more) samples will produce two (or more) adjacent peaks in the MS or MS/MS spectra in the data; and the quantity ratio of the peptide can be calculated from the peak intensity ratio. Many details are omitted here because the main topic of this article is label-free quantification.
The label-free quantification does not use isotope labelling. Instead, each sample is measured in a separate LC-MS/MS experiment. Efforts are made to maximize the reproducibility of different LC-MS/MS runs. Therefore, in each run, the same peptide tends to be observed at the same m/z (mass-to-charge ratio) and similar LC retention time. This makes it possible (although not trivial) to map together the signal produced by the same peptide from different samples. And the quantity ratio of the peptide can be computed from the signal intensities (namely peak area).
Despite some debates between the supporters of labelling and label-free methods, the two methods both have their own advantages over each other, and are suitable for different situations. The PEAKS Q software can perform both labelling and label-free quantification analysis.
The advantages of the labelling method include:
- It is relatively easy to map the signals of the same peptide from two samples. This leads to a much simpler data analysis, and minimized artifacts introduced by the data analysis software.
- The two samples are handled together most of the time during the experiment (except for the isotope labeling). This makes it more reliable to calculate the peptide quantity ratio from the peak intensity ratio.
The advantages of the label-free method include:
- No sample loss and error introduced by the labeling step.
- Some labelling methods may not be applicable to certain samples, but there is no such limitation for label-free.
- Number of samples not limited by the number of label choices.
- The sample group does not need to be determined before the experiment. This creates the flexibility to use the same datasets to study different condition changes.
In the above discussion, the advantages of a method are naturally the disadvantages of the other method. But both methods are being developed and adjusted to overcome their own disadvantages. For example, the super-SILAC method can handle theoretically unlimited number of samples. And the mapping of peptides in label-free is getting more and more reliable due to the improved reproducibility of the HPLC and the development of advanced bioinformatics algorithms. A complete review of these developments is beyond the scope of this page. In the following section we focus on the data analysis for the label-free method.
A label-free quantification measures each sample with a separate LC-MS run. The data can be visualized as in Figure 2. In the figure, the greyscale of each pixel represents the peak intensity of the LC-MS data at the corresponding mass to charge ratio (m/z) and the LC retention time (RT). Since a peptide elutes in a small RT window, it will cause a vertical grey line in the figure. Additionally, the isotopes of the peptide cause several parallel vertical lines. Each cluster of parallel vertical lines is called a “peptide features”, which indicates the existence of a peptide. In one typical experiment there can be thousands of features detected for each LC-MS dataset.

The software analysis of the label-free quantification data typically involves all or some of the following steps:
- Feature detection: find a list of peptide features from the raw LC-MS data.
- Feature quality assessment: The software also needs to assess the quality of a detected peptide feature, since lower quality features often lead to higher noise in the later peptide/protein ratio calculation.
- Time alignment: correct the retention time shift and distortion caused by the imperfect reproducibility of HPLC.
- Feature matching: match the peptide features from different samples, so that the features caused by the same peptide in different samples are put together in a single “feature vector”.
- Peptide assignment: assign the peptide sequence for each detected peptide feature vector. This usually requires that MS/MS is performed during the LC-MS, and the peptides are identified from the MS/MS spectra.
- Peptide ratio calculation: calculate the signal intensities (peak area) ratio of the features in each feature vector.
- Protein ratio calculation: average the peptide ratios to compute the protein ratios. Usually only the top few peptides that are unique to the protein are used.
- Significance evaluation: by combining the feature quality and the peptide/protein fold change, the software needs to assess if the observed fold change is statistically significant. A high fold change may not be statistically significant if its calculation is solely based on low quality feature vectors.
The PEAKS Q’s label-free quantification algorithm involves all of the above steps. Some steps are based on published algorithms for the time alignment and feature matching steps[1]. The other steps are based on newly researched and unpublished algorithms within Bioinformatics Solutions Inc.
References
- Lin, H., He, L., Ma, B. A combinatorial approach to the peptide feature matching problem for label-free quantification. Bioinformatics, 2013 Jul 15;29(14):1768-75