Multiple-Group SILAC-based Quantitative Proteome Analysis
A published dataset [1] was used as an example to demonstrate the capability of multiple-group SILAC-based data analysis in PEAKS Studio.
Study Aims & Background
Adenocarcinoma (ADC) and squamous cell carcinoma (SCC) are the two major histological subtypes of non-small cell lung cancer (NSCLC), which are associated with patient prognosis. One of the main goals of the study was to identify signature proteins that distinguished the ADC and SCC subtypes.

Experimental Design
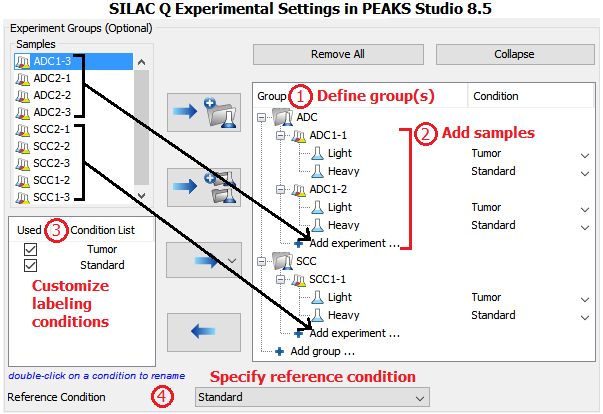
Four patient tumor-derived xenograft proteomes (two ADC and two SCC, each with 3 replicates) were quantified and compared by the super-SILAC approach. Three NSCLC cell lines were labeled with 13C615N2-lysine (K8) and 13C615N4-arginine (R10) and heavy proteins were combined and used as the super-SILAC standard. The standard was spiked into non-labeled xenograft tissues at 1:1 protein ratio. Therefore, protein expression levels in ADC and SCC xenografts were compared with reference to the super-SILAC standard.
MS data was analyzed in PEAKS Studio 8.5 using the built-in SILAC-2plex (R10, K8) method in PEAKS Q for quantification.
Result
- Normalization of SILAC ratios in each sample
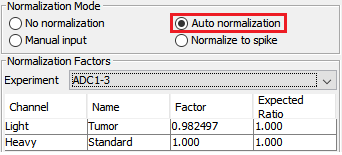
Auto normalization was first performed in PEAKS Q so that the total light and heavy intensities in each sample were equivalent since the same amount of light and heavy proteins were mixed. The adjusted normalization factor is displayed for each sample in the normalization setting window.
- Identification of differentially expressed proteins between groups
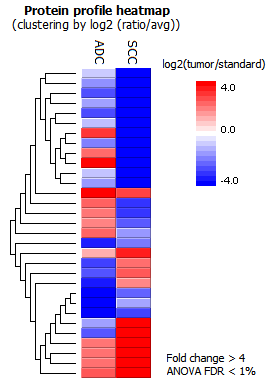
SILAC ratios of proteins were calculated using the median of peptide ratios (MS1 peak area in the labeling channel relative to the reference channel). Proteins that had significantly differential expressions between ADC and SCC groups could be identified by applying a fold change filter of, e.g. at least 4, and an ANOVA test FDR 1% threshold. Welch’s ANOVA is the statistical tool integrated in PEAKS Q for multi-group SILAC data analysis.
Conclusions
PEAKS Studio supports complex SILAC data analysis and offers built-in statistical tools to identify proteins with significant changes of expression levels.
References
- Zhang, W., Wei, Y., Ignatchenko, V., Li, L., et al., Proteomic profiles of human lung adeno and squamous cell carcinoma using super-SILAC and label-free quantification approaches. Proteomics 2014, 14, 795-803.