
ProteoformX is a powerful user-friendly software designed to make intact and top-down mass spectrometry accessible and actionable. It combines rapid intact mass profiling to globally assess detectable proteoform diversity with in-depth top-down analysis to resolve full protein sequences, map modifications, and enable quantification. Brand new to ProteoformX are two modules, New Peak Detection and Peptide Mapping, delivering deeper proteoform insight with greater accuracy, speed and confidence! CFR-compliance readiness also ensures data integrity, security, and audit preparation in any clinical or biopharmaceutical setting!
Key Features

Intact Mass Analysis

Top-down Proteoform Search
Proteoform Manager

New Peak Detection

Peptide Mapping
Contact us to add ProteoformX to your research!
Top-down Proteome Search
Top-down MS enables in-depth characterisation of proteoforms, including precise PTM localisation. However, challenges such as data complexity and limited sequence coverage can limit throughput. In ProteoformX™, the unparalleled user interface helps users to manually check the result from raw data to identification. Diverse fragmentation methods such as CID, HCD, ETD, ETHCD, and UVPD are supported.
⭐ Bottom up assisted Top-down/middle down
⭐ Diverse fragmentation methods supported
⭐ Trace every proteoform with hierarchical insight
⭐ Open search

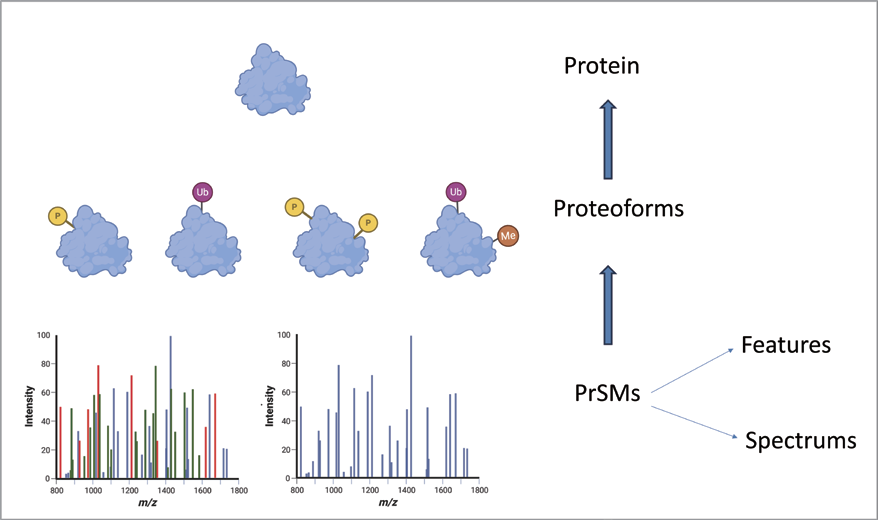
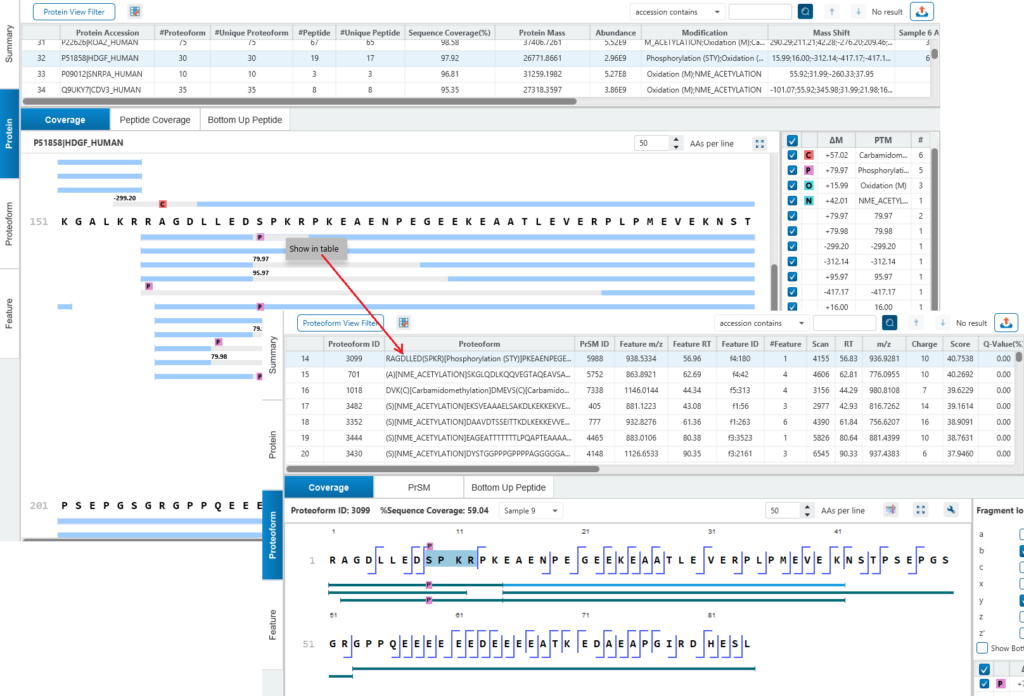
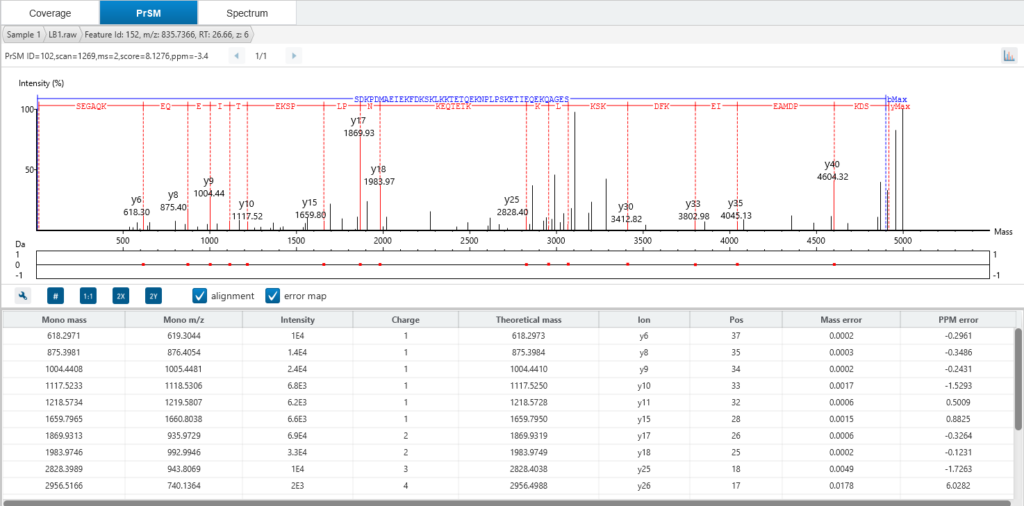
The ProteoformX™ software application provides hierarchical information with feature based identification algorithm. A flexible user interaction that enables linkage between different views, allowing seamless access to information from raw data to proteoform spectrum match (PrSM) and protein inference.
In the Protein tab, the coverage pane shows proteoforms mapped to the protein sequence and peptide coverage shows all peptide from bottom-up mass mapped to protein sequence. In the Coverage view, grey bars indicate regions where a mass tag is associated with the sequence, representing a mass shift and possible modification. However, these regions lack fragment ions for site-specific localisation of the mass tag.
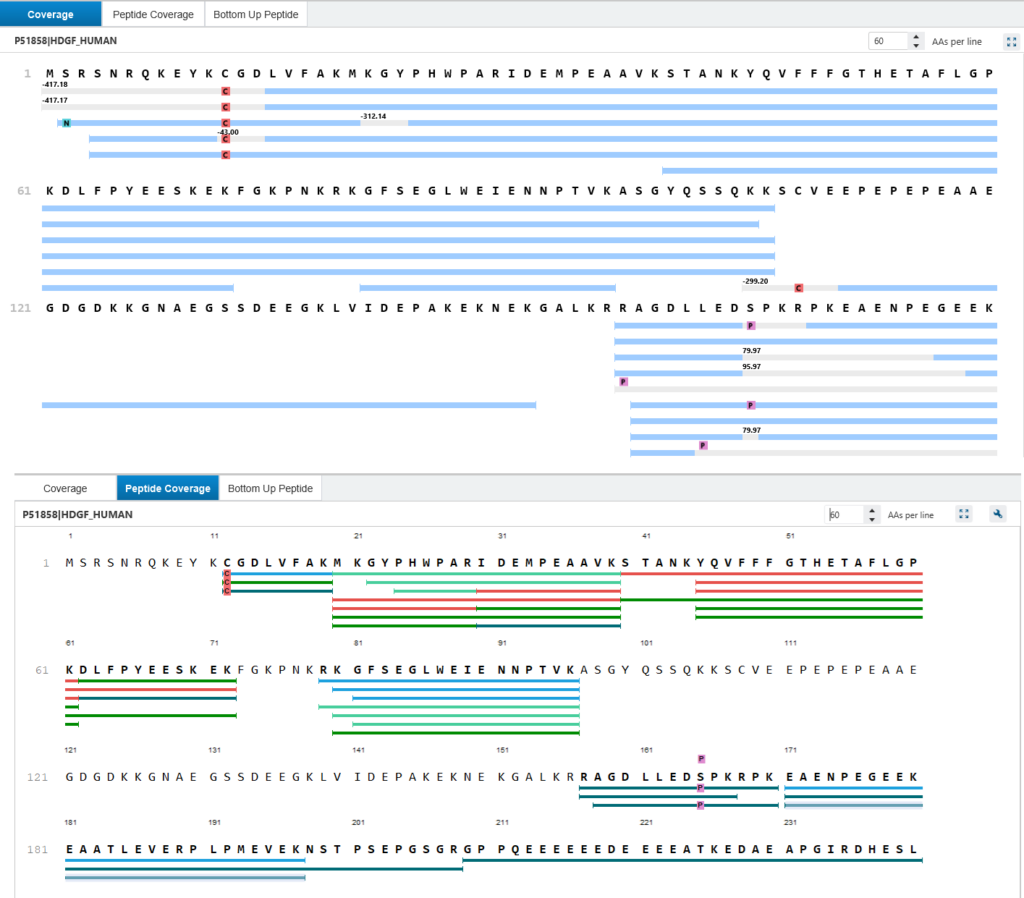
In the Proteoform tab, the sequence coverage is defined by the percentage of the amino acid sequence supported by top-down fragment ions. Modifications or mass shifts with respect to the mass of the amino acid sequence are shown in the result view. If a modification can be localised to a single amino acid using bottom-up data, the corresponding residue in the top-down fragment will be highlighted in yellow.
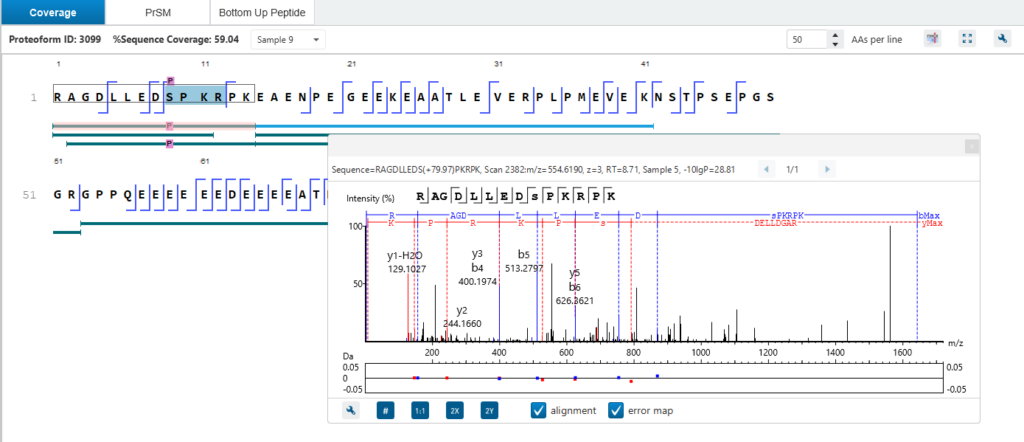
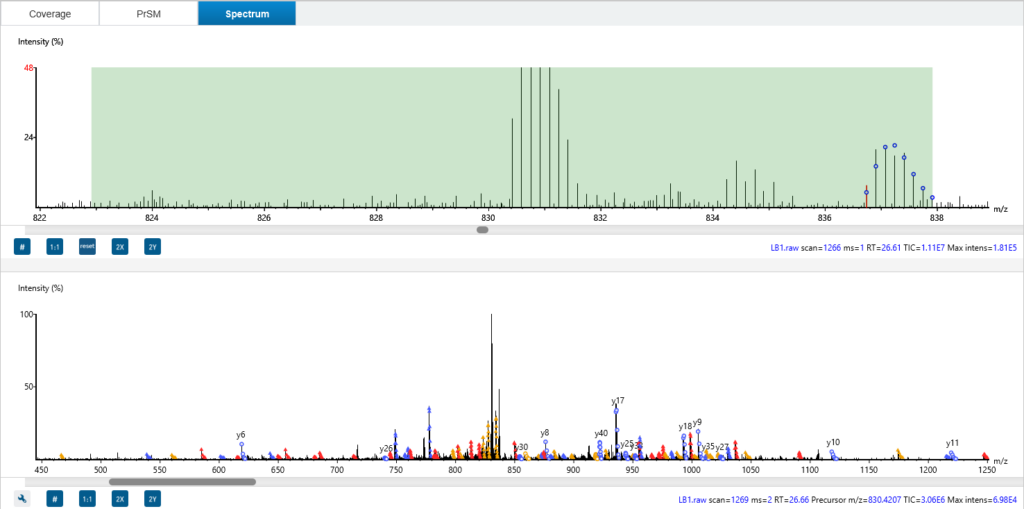
A deeper dive into the Proteoform tab shows how each ID is supported by high-quality PrSMs (deconvoluted MS2 spectra), fragment ion mass table, and interactive sequence fragmentation maps. The Spectrum tab in ProteoformX™ overlays theoretical precursor peaks and fragment ions directly onto the MS1 and MS2 scans—so users can visualise isotopic envelopes, assess isolation windows, see exactly which ions contributed to the deconvolution, or even get chimera spectrum information. Colour-coded annotations make it easy to distinguish ion types, giving you unmatched transparency and confidence in your results.
Feature-based insight of the data (LC-MS view)
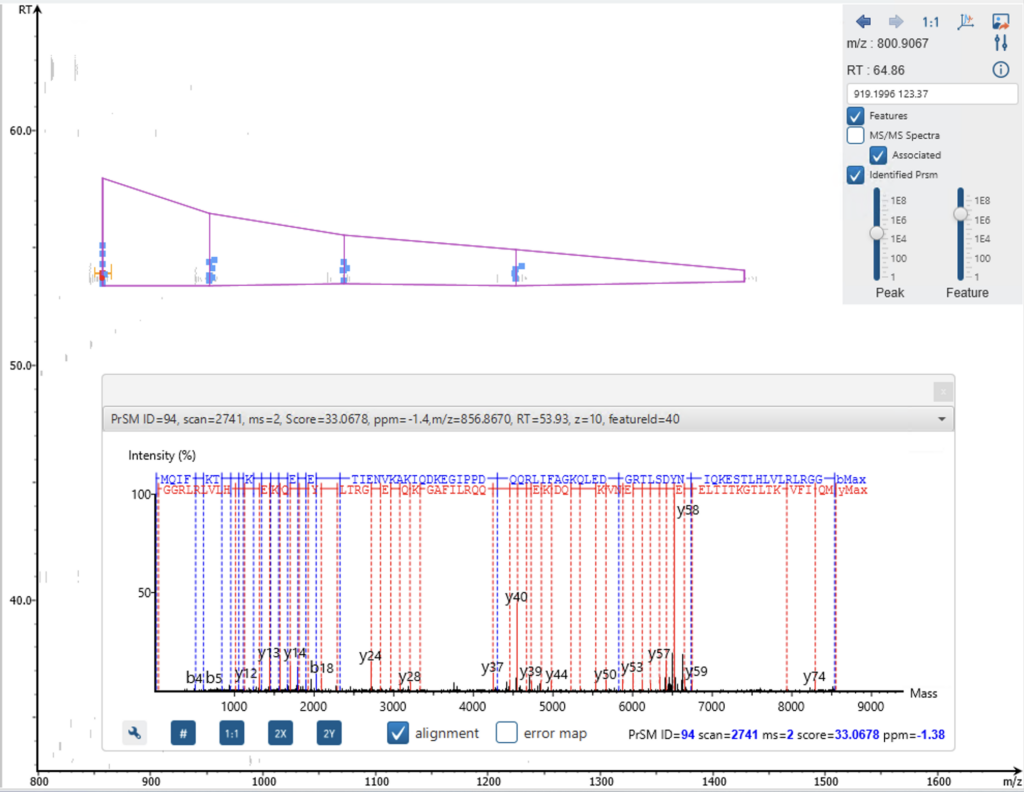
As a feature-based algorithm for intact and top-down analysis, ProteoformX™ provides LC-MS view with MS/MS spectra and associated features.
In-depth top-down proteome identification with open search
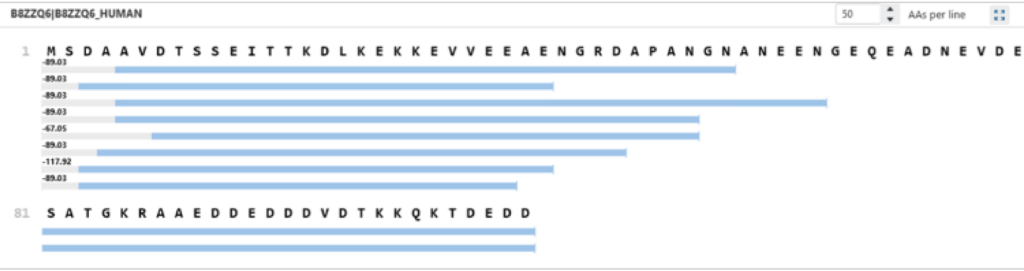
Enabling OpenPTM Search increases proteoform identification by allowing for unexpected modifications and truncated forms. In the example below, only two C-terminal proteoforms of the B8ZZQ6 protein were identified without OpenPTM Search, while eight were detected when it was enabled. One of these additional proteoforms featured a –89.03 Da mass shift, consistent with methionine loss and N-terminal acetylation—an established but often overlooked modification. By broadening the search space to include mass shifts and non-canonical termini, OpenPTM Search enables more comprehensive and accurate proteoform profiling.

Intact Mass Analysis
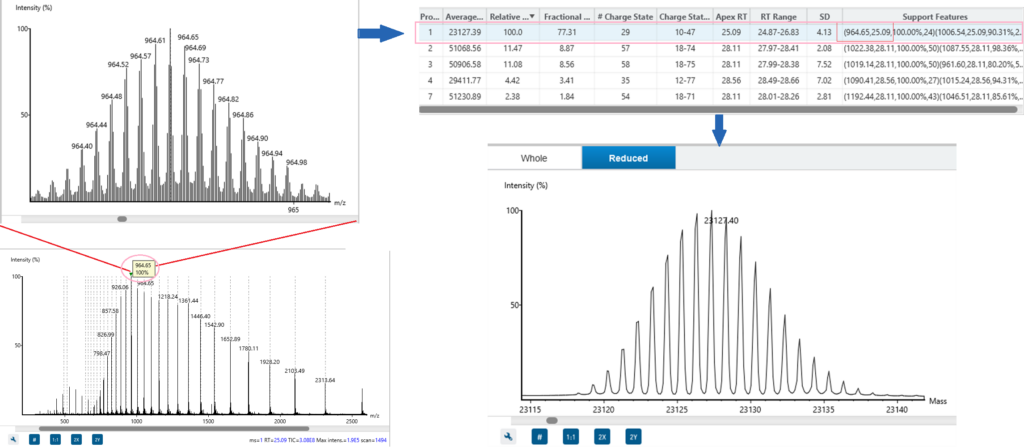
High precision mass deconvolution
Feature-based mass deconvolution identifies proteoform masses with high sensitivity and specificity, for isotopically resolved or unresolved data, across a wide range of sample types.
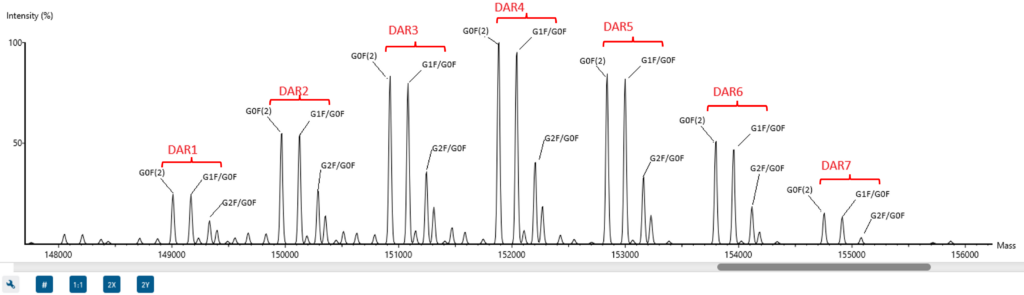
Comprehensive sample annotation with modifications and ADC drug payload
Intact mass workflow delivers accurate annotation for complex and sub-unit proteoforms, even for heterogeneous samples with modifications and ADC drug payload.
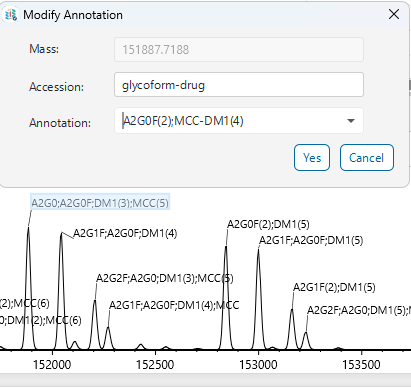
Manual annotation editing for expert curation
By default, the software assigns the annotation with the smallest mass error between the theoretical and measured values. However, this may not always reflect the expected or biologically relevant assignment. With the new function, manual annotation, users can manually select alternative candidates based on their knowledge, or even directly input a custom assignment.
Glycosylation profile at proteoform level
Intact deconvolution accurately detects the glycosylated proteoforms of an antibody mixture.
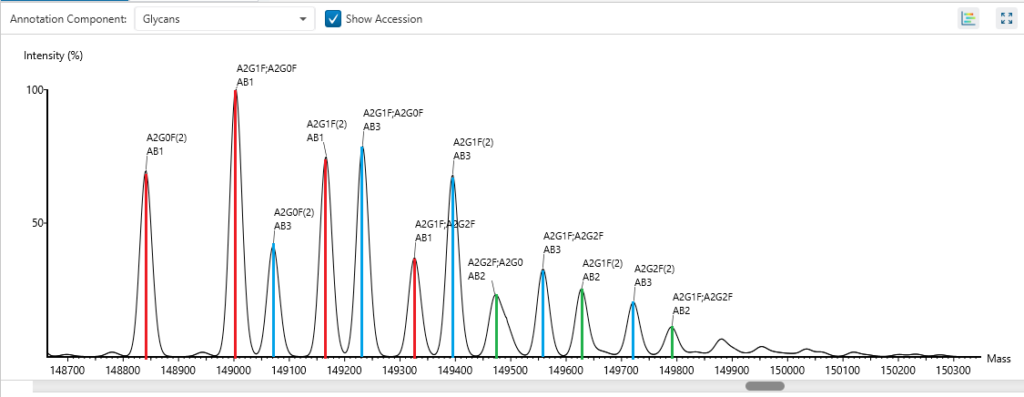
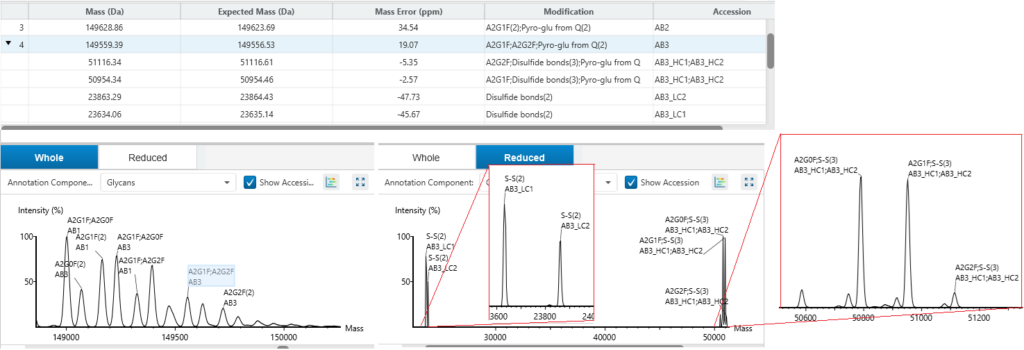
Antibody heavy chain and light chain pairing
Intact annotation determines antibody heavy and light chain pairings, enabling characterisation of all antibody forms, including asymmetric antibodies and mixtures.
Comprehensive result view
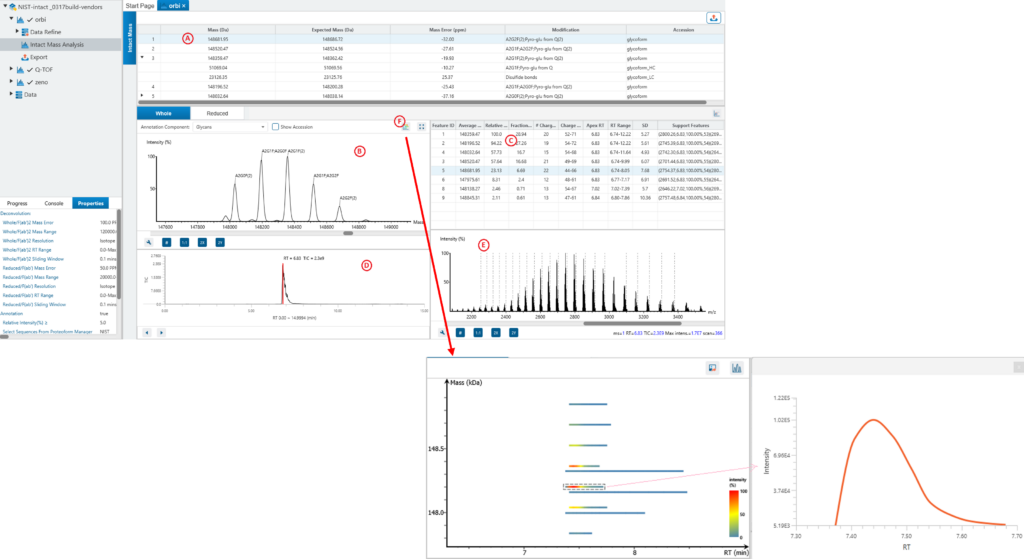
ProteoformX™ provides comprehensive results, including interactive spectrum views with annotated peaks for transparent interpretation, along with supporting features in mass deconvolution tables that can be directly used to guide targeted top-down MS/MS experiments. The proteoform heatmap view intuitively displays its elution profile.
New Peak Detection
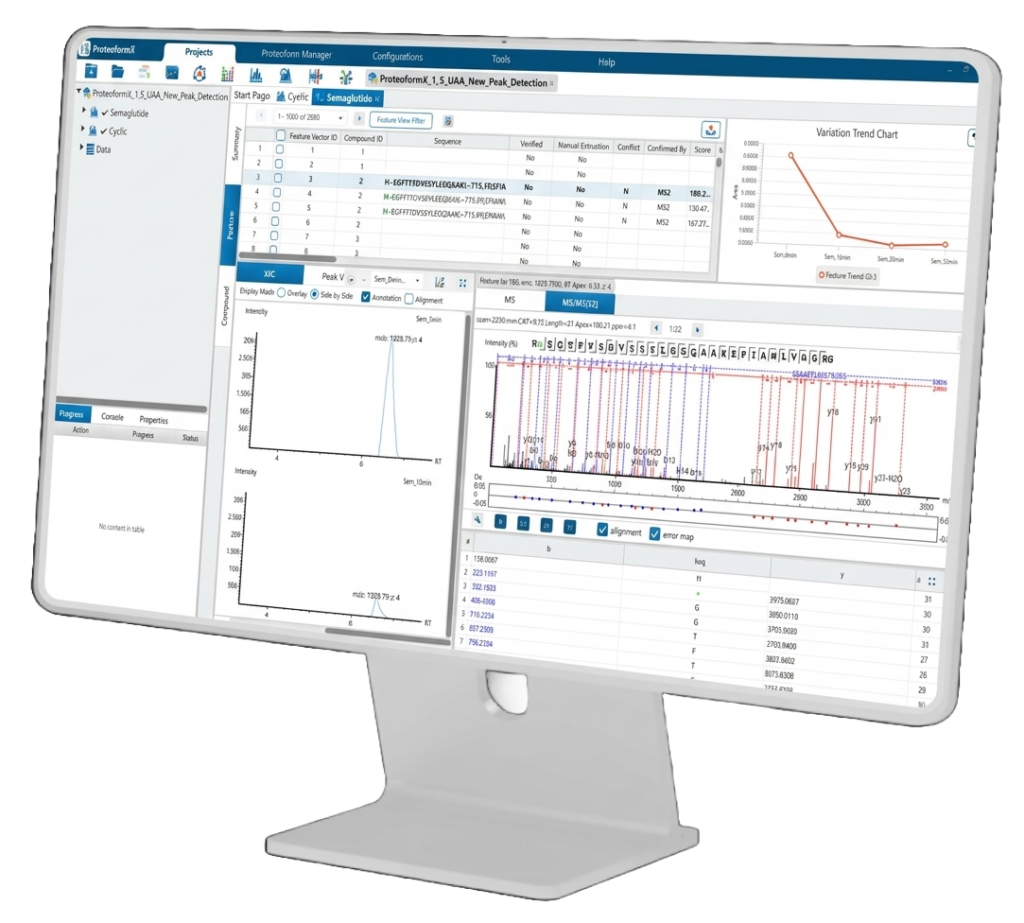
New Peak Detection detects emerging peaks and tracks variation trends in biopharmaceutical metabolites, product‑related impurities, and molecular changes. Essential for characterizing complex biopharmaceutical molecules by mass spectrometry, this feature also supports linear, branched, and cyclic peptides, including sequences containing unnatural amino acids and nucleotides, with added manual validation to support pharmaceutical workflows.
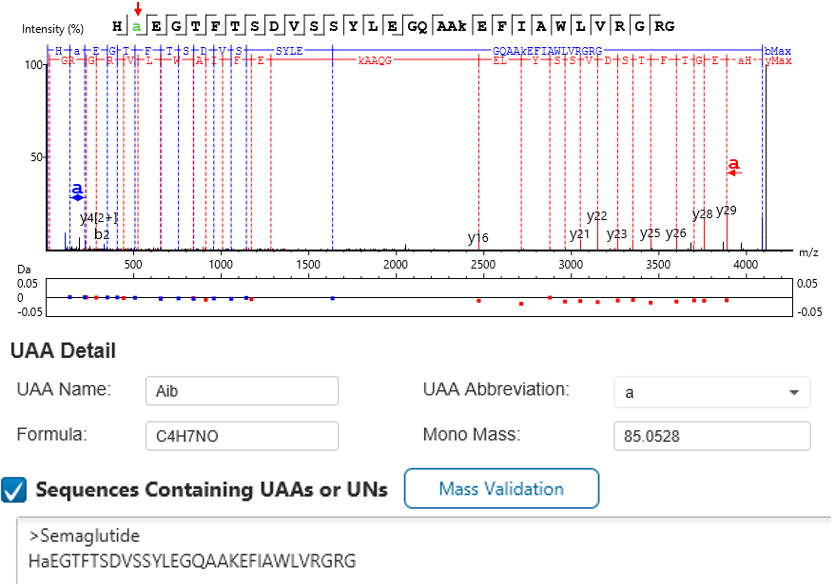
Characterization of peptides with unnatural amino acids and nucleotides
Peptide biotherapeutics commonly have unnatural amino acids (UAAs) and unnatural nucleotides (UNs). However, common mass spectrometry data analysis tools were built with limitations to search only the canonical amino acids. In this module users can define UAAs/UNs, where New Peak Detection will use both MS1 and MS2 data to enable confident identification and quantification, monitoring trends of molecular changes. Improving the accurate analysis and characterization of complex peptide biotherapeutics.
Characterization of linear, branched, and cyclic peptides
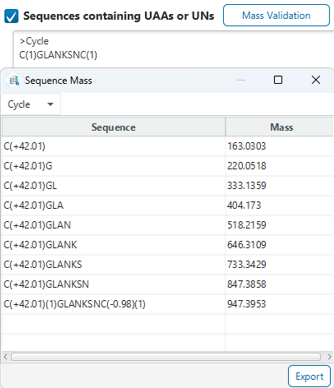
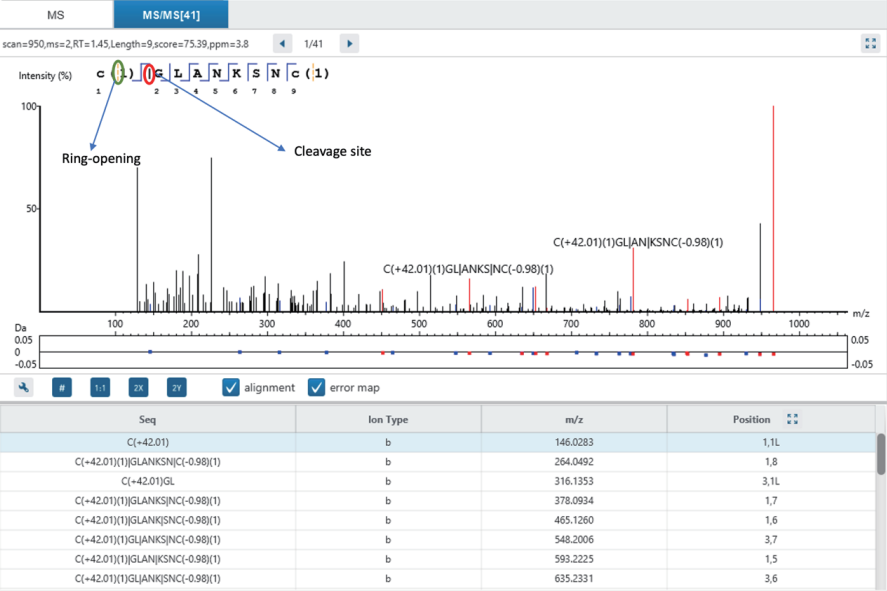
Many biotherapeutics are no longer simple linear molecules, they can include branched or cyclic structures, requiring specialized annotations and analysis. New Peak Detection supports linear, branched, and cyclic structures providing specialized MS2 annotations for branching, ring openings, and cleaved cyclic peptide fragmentation (the yellow dotted line indicates the ring opening at disulfide bond; the black vertical bar is a cleavage site). Additionally, to help users verify the accuracy of their input, a mass validation tool is provided, which calculates the theoretical masses generated at different cleavage positions. This allows for monitoring variation trends of complex molecules with high sensitivity. Finally, map impurities against a background protein FASTA or search for novel peptides using de novo.
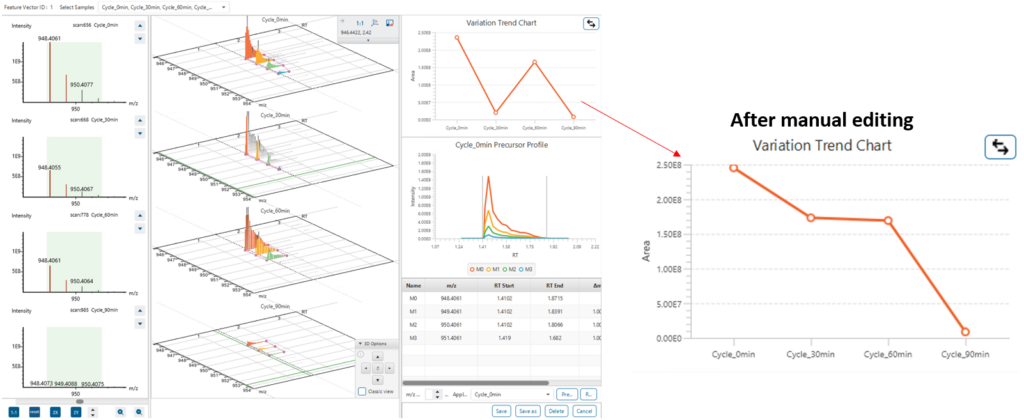
Manual editing of feature detection
Automated feature detection may miss certain features due to factors such as low concentrations of degradation products, peak shape inference, or matrix effects. The Feature Editor function is designed to address this challenge by allowing users to manually and accurately select and define incorrectly detected or previously unidentified features in the target chromatogram. Use the feature editor button to access the manual feature detection interface.
Peptide Mapping
Peptide Mapping is one of the latest newly featured workflows in ProteoformX. It enables the characterisation of proteoforms from enzymatically digested samples. That includes mapping of peptide sequences to various proteoforms, identification of post-translational modifications (PTMs) and sequence variants using peptide-level information.
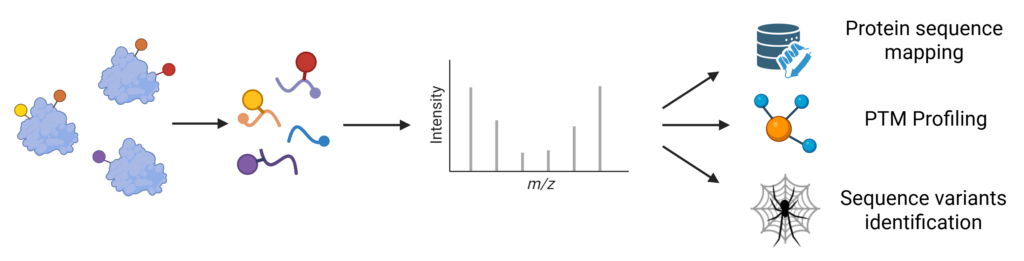
Bottom-up MS data can now be utilized to characterise the complete proteoform landscape of target proteins with the newly incorporated PTM profiling functions. Featuring the PEAKS PTM and Open PTM search algorithms, Peptide Mapping now enables identification and quantification of not only known and common modifications, but also uncommon and unknown modifications. Together with the use of Sequence Variants function for identification of mutations, this workflow enables users to acquire a complete overview of possible proteoforms that provides functional insights.
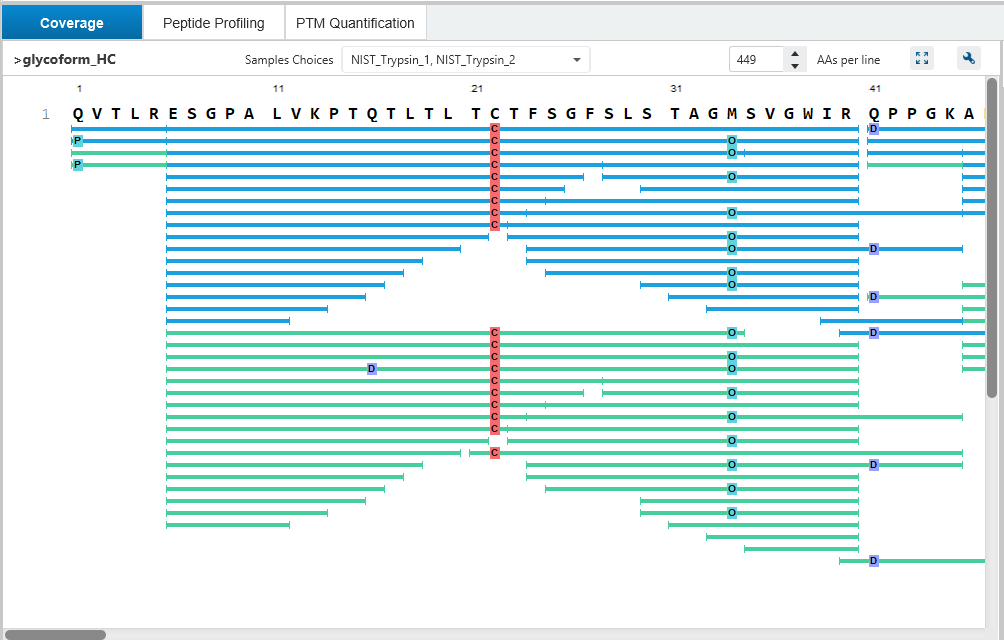
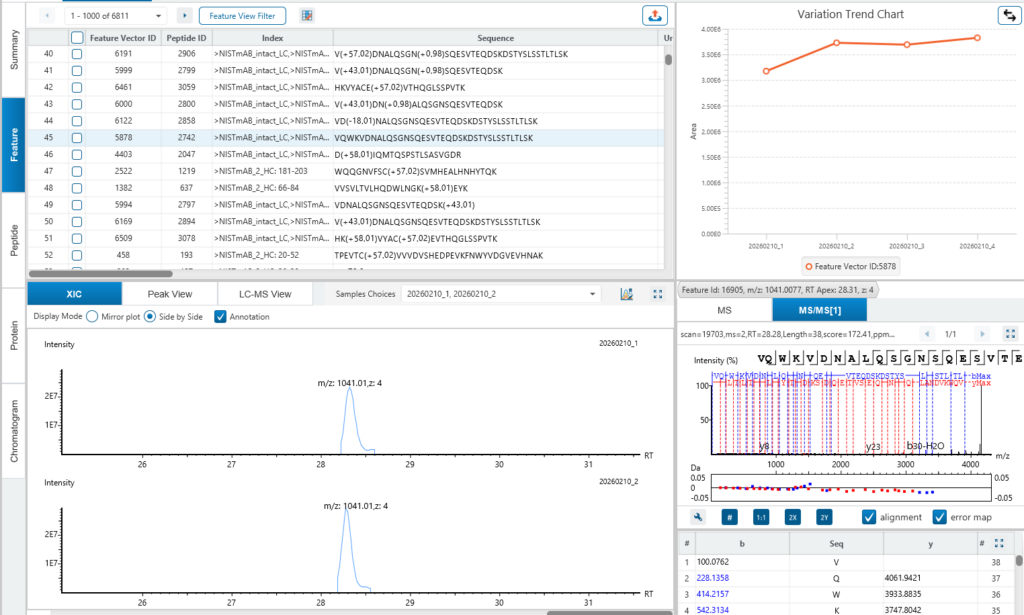
Aside from the enhanced qualitative features, users can also investigate quantitative variations between samples. By selecting Representative Peptides in the Feature or Peptide tabs, users can manually inspect changes of peptide abundance across samples to inform functional outcomes or batch differences.
Proteoform Manager
Flexible definition and visualisation of proteoforms
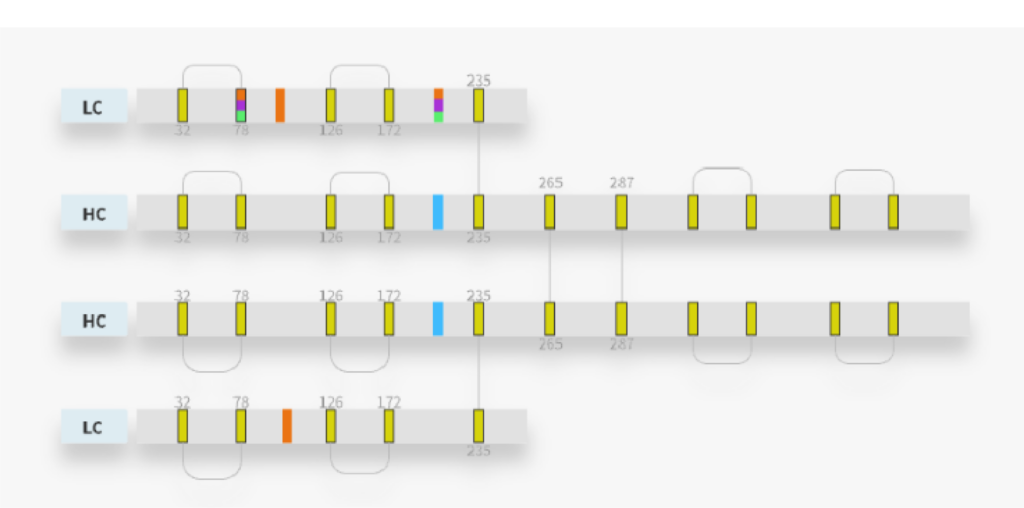
The Proteoform Manager in ProteoformX™ provides an intuitive interface for defining intra- and inter-chain linkages, cleavage sites, site-specific PTMs, and glycosylation events. These capabilities support comprehensive modelling of complex proteoforms relevant to biopharmaceutical analysis. Proteins can be interactively customised through a modular interface. The visual editor employs color-coded symbols and intuitive annotations to highlight sequence modifications and structural variations, allowing users to easily build, modify, and validate proteoforms with mutations or heterogeneous glycoforms.
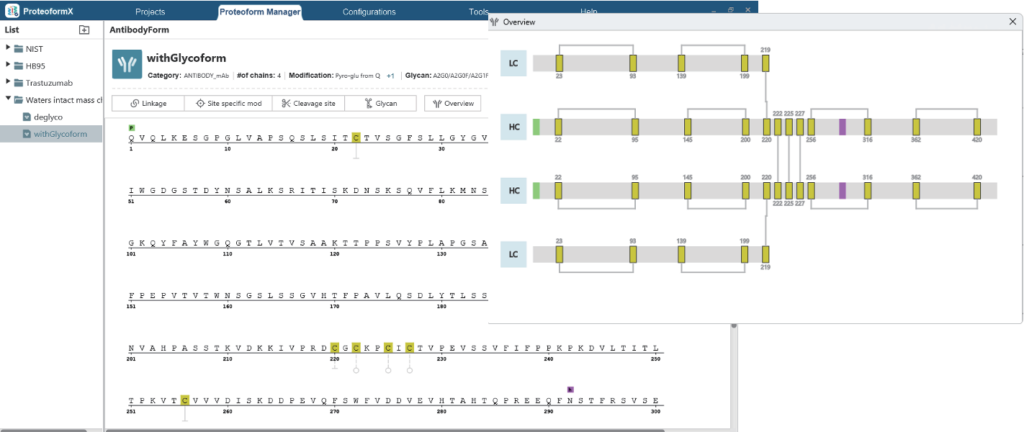
For example, the easy-to-use Proteoform Manager allows you to define an antibody at the proteoform level, including site-specific modifications, glycoforms, linkages, and cleavage sites.
References
- Li K, Shan B, Xin L, Li M, Wang L. Proteoform search from protein database with top-down mass spectra. Nat Comput Sci. 2025 Nov;5(11):998-1009. doi: 10.1038/s43588-025-00880-z. Epub 2025 Oct 3. PMID: 41044386.
- Basharat AR, Zang Y, Sun L, Liu X. TopFD: A Proteoform Feature Detection Tool for Top-Down Proteomics. Anal Chem. 2023 May 30;95(21):8189-8196. doi: 10.1021/acs.analchem.2c05244. Epub 2023 May 17. PMID: 37196155; PMCID: PMC10233584.
- Choi IK, Liu X. Top-Down Mass Spectrometry Data Analysis Using TopPIC Suite. Methods Mol Biol. 2022;2500:83-103. doi: 10.1007/978-1-0716-2325-1_8. PMID: 35657589.
- Roberts, D.S., Loo, J.A., Tsybin, Y.O. et al. Top-down proteomics. Nat Rev Methods Primers 4, 38 (2024). doi:10.1038/s43586-024-00318-2
- Intact mass and bottom-up enhanced top/middle-down analysis for antibody characterization with ProteoformX Software
- Using New Peak Detection to Characterize the linear or cyclic peptides with non-canonical amino acid by LC-MS
- Evaluating critical quality attributes of bispecific antibodies by multi-level mass spectrometry