PTM Profiling in SILAC-based Quantitative Proteome Analysis
A published dataset [1] was used as an example to demonstrate the capability of SILAC-based data analysis (PTM profiling) in PEAKS Studio.

Study Aims & Background
The two major isoforms of the oncogenic Bcr–Abl tyrosine kinase, p210 and p190, were suggested to contribute to different types of leukemia. One of the main goals of the study was to identify differential signaling networks of Bcr-Abl p210 and p190 kinases in leukemia cells by using quantitative proteomics approaches [1]. Bcr–Abl is a fusion protein and a constitutively active tyrosine kinase. p190 is ~25% shorter than p210 due to a lack of a DH–PH domain unit; otherwise p210 and p190 have an identical sequence and domain organization (Figure 1A).
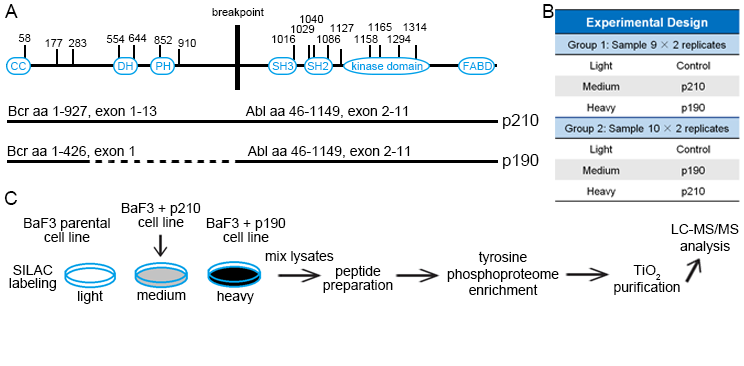
Figure 1. Bcr-Abl protein domain organization (A) and overview of the phosphoproteome experiments (B, C).
Experimental Design
Murine BaF3 cells that express Abl endogenously were retrovirally transduced with the human Bcr–Abl p210 and p190 cDNAs. Parental (untransduced) BaF3 cells were used as a control and grown in SILAC light media (Figure 1C). Cells that expressed human p210 and p190 were labeled with SILAC medium and heavy media and swapped between 2 experiments (defined as Exp 1 and 2 in Figure 1B). Phosphotyrosine peptides were enriched and analyzed by high-resolution LC-MS/MS.
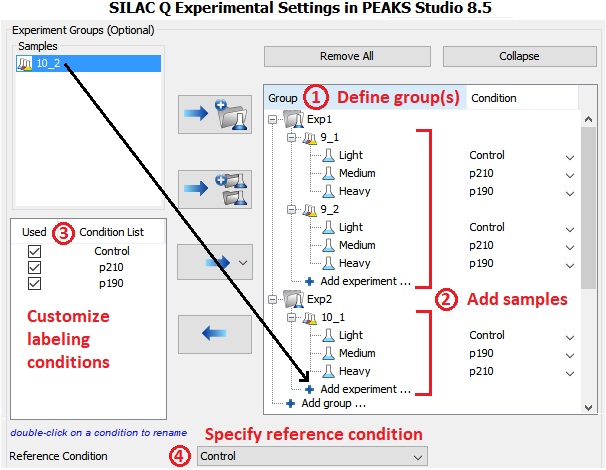
MS data was analyzed in PEAKS Studio 8.5 using the built-in SILAC-3plex (R6, K4|R10, K8) method in PEAKS Q for quantification.
Result
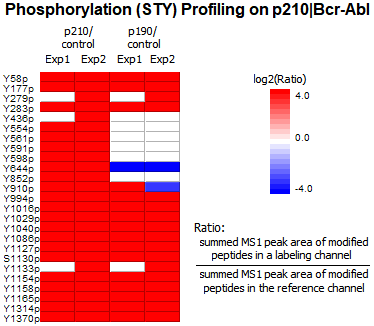
- The Phosphorylation Profile of p210/p190 with PEAKS PTM Profile
The phosphorylation profile of Bcr-Abl proteins were analyzed with the PTM Profile function in PEAKS. 25 tyrosine phosphorylation sites of Bcr-Abl were quantified (Ascore [2] > 20). As expected p210 and p190 samples showed higher phosphorylation signals compared to controls. For each confident PTM site, MS1 peak area of modified peptides are summed for each labeling channel and ratios relative to the reference channel are calculated automatically and displayed in the heatmap, enabling easy comparative quantitation of PTM abundances between samples and across groups. Furthermore, PTM quantification results can be normalized by protein expression levels automatically.
Conclusions
PEAKS Studio supports complex SILAC data analysis and quantitative PTM profiling analysis.
References
- Reckel, S., Hamelin, R., Georgeon, S., Armand, F., et al., Differential signaling networks of Bcr-Abl p210 and p190 kinases in leukemia cells defined by functional proteomics. Leukemia 2017.
- Beausoleil, S. A., Villen, J., Gerber, S. A., Rush, J., Gygi, S. P., A probability-based approach for high-throughput protein phosphorylation analysis and site localization. Nature biotechnology 2006, 24, 1285-1292