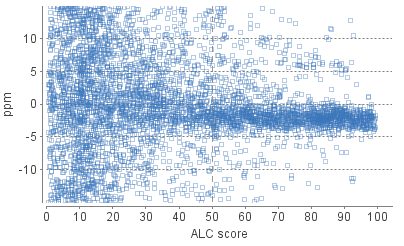
Figure 1(a) is a scatter plot showing de novo sequences’ ALC score versus precursor mass error in ppm.
In a typical de novo sequencing analysis, peptides with higher ALC scores are more likely to have a small mass error, indicating a higher chance for the peptide to be correctly sequenced. This figure provides a rule-of-thumb for setting the ALC score threshold. The threshold can be set at the score where precursor mass error starts to converge.
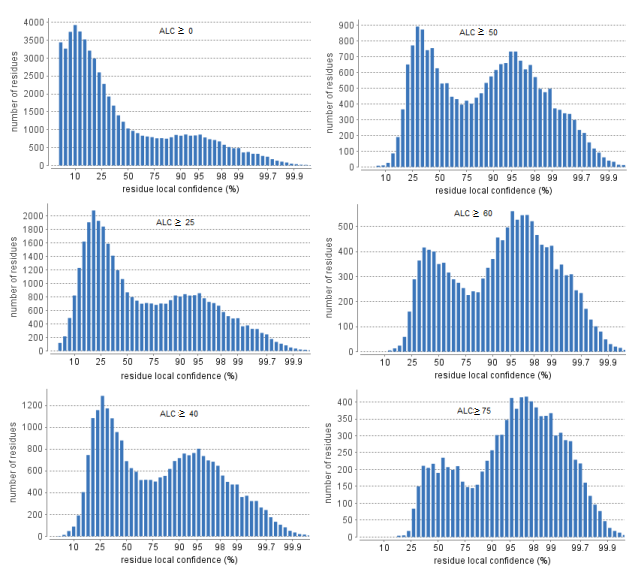
Residue Local Confidence Distribution
Figure 1(b) shows the local confidence score distribution of residues in filtered de novo sequences.
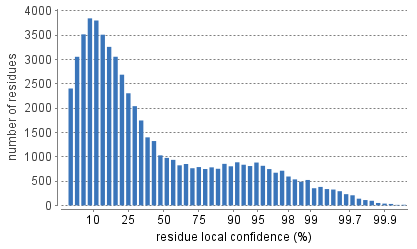
It is essentially a mixed score distribution of both correct and incorrect residues. This figure allows you to examine the proportion of correct and incorrect residues when adjusting the ALC threshold.
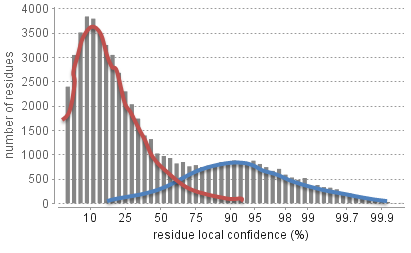
By increasing the ALC threshold, the number of incorrect residues will decrease because poor sequences are filtered out first. It is recommend to gradually raise the ALC threshold until the number of correct residues starts to significantly decrease.